Uncertainty Is High, and That Could Affect Your Investments
It’s often said that stock market investors dislike uncertainty. When conditions are uncertain, that can lead to a bear market. Uncertainty could be caused, for example, by unclear announcements of central bank policy, debates about tax increases or new regulations, or slowing economic growth.
A means of quantifying the degree of uncertainty was highlighted in a recent quarterly earnings call. The CEO of Prologis noted:
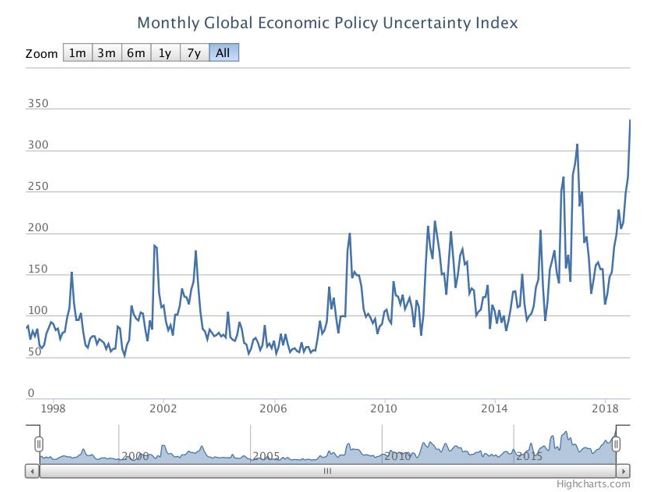
“Let me just add one more comment that I found the most interesting, probably the most interesting statistic that I’ve seen about the economy is something called the global Economic Policy Uncertainty Index…it’s a scale of the degree of policy uncertainty around the world.
And let me give you a couple of points. During the 9/11 attack and the Iraq-Iran – excuse Iraq war breaking out that index was at 200. At the peak of the global financial crisis it was at 210 and Brexit it got to 300…
…and today given the China war and the government shutdown and all that it’s well north of 300. Now I have no idea whether there is any academic rigor or anything related to this index, but I just found it fascinating that the world thinks we’re in a much less certain environment.
Now certain is – uncertain is usually viewed as bad.”
That quote highlighted the index, which is in fact based on a high degree of rigor and was developed by economists associated with the International Monetary Fund (IMF).
Quantifying Uncertainty
The index is designed to measure policy related to economic uncertainty and is constructed as an index from three types of underlying components.
One component quantifies newspaper coverage of policy-related economic uncertainty. A second component reflects the number of federal tax code provisions set to expire in future years. The third component uses disagreement among economic forecasters as a proxy for uncertainty.
The first component is an index of search results from 10 large newspapers. The newspapers included in the index are USA Today, the Miami Herald, the Chicago Tribune, the Washington Post, the Los Angeles Times, the Boston Globe, the San Francisco Chronicle, the Dallas Morning News, the New York Times, and the Wall Street Journal.
From these papers, the developers construct a normalized index of the volume of news articles discussing economic policy uncertainty.
The second component of the index draws on reports by the Congressional Budget Office (CBO) that compile lists of temporary federal tax code provisions.
The developers create annual dollar-weighted numbers of tax code provisions scheduled to expire over the next 10 years, giving a measure of the level of uncertainty regarding the path that the federal tax code will take in the future.
The third component of the policy related to uncertainty index draws on the Federal Reserve Bank of Philadelphia’s Survey of Professional Forecasters.
Here, the developers utilize the dispersion between individual forecasters’ predictions about future levels of the Consumer Price Index, Federal Expenditures, and State and Local Expenditures to construct indices of uncertainty about policy-related macroeconomic variables.
The authors explain:
“We construct a new index of uncertainty—the World Uncertainty Index (WUI)—for 143 individual countries on a quarterly basis from 1996 onwards. This is defined using the frequency of the word “uncertainty” in the quarterly Economist Intelligence Unit country reports.
Globally, the Index spikes near the 9/11 attack, SARS outbreak, Gulf War II, Euro debt crisis, El Niño, European border crisis, UK Brexit vote and the 2016 US election.
Uncertainty spikes tend to be more synchronized within advanced economies and between economies with tighter trade and financial linkages.
The level of uncertainty is significantly higher in developing countries and is positively associated with economic policy uncertainty and stock market volatility, and negatively with GDP growth. In a panel vector autoregressive setting, we find that innovations in the WUI foreshadow significant declines in output.”
Recent data is shown in the chart below.

Source: PolicyUncertainty.com
The current value is much higher than it has been at any time in the past. There are also indexes available to track the level of uncertainty in several countries and regions.
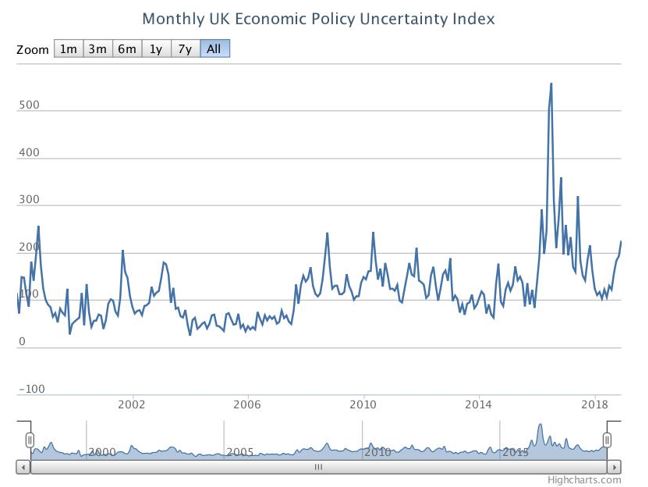
It is interesting to begin with a look at the index for the United Kingdom. Brexit is roiling the country and the deadline lies just weeks away with no consensus of what will happen. It would seem to be the very definition of uncertainty.

Source: PolicyUncertainty.com
The index is rising but is well below the highs seen around the time of the Brexit referendum. It would seem that despite the great deal of uncertainty associated with this event, the United Kingdom is not the primary cause of the spike in global uncertainty.
The US and China Account for the Uncertainty
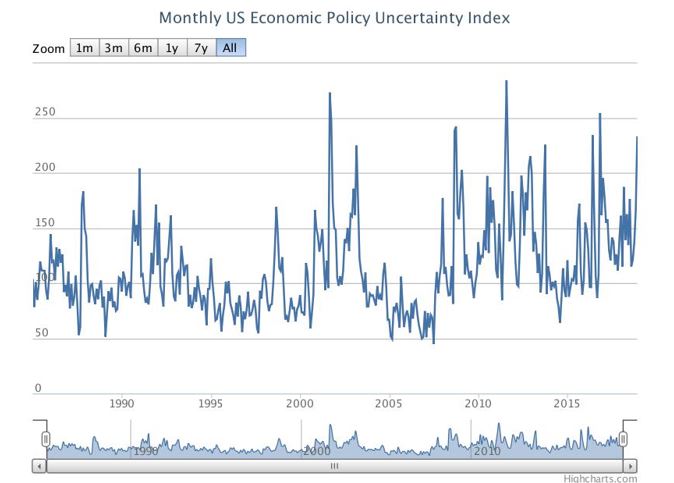
The next chart shows the index for the United States.

Source: PolicyUncertainty.com
Here, we see that there have been several regimes of uncertainty with the general level of the index having risen to a high level in recent years. The index seems to have reached a higher plateau than it reached in the past and may have become almost permanently elevated.
The authors note, “as measured by our index, we find that current levels of economic policy uncertainty are at extremely elevated levels compared to recent history.
Since 2008, economic policy uncertainty has averaged about twice the level of the previous 23 years.”
While this transition predates the election of President Trump, there seems to be no doubt that Trump’s policies have resulted in the elevation. This is confirmed by the next chart which shows the index for China.

Source: PolicyUncertainty.com
The spike in the past few months has been relentless and appears to be related to threats of a trade war.
The elevated level of uncertainty could be a concern for investors. The developers have observed, “We find that an increase in economic policy uncertainty as measured by our index foreshadows a decline in economic growth and employment in the following months.”
And, this seems to affect the stock market, “We find that the number of large movements in the S&P 500 index, defined as a daily change of 2.5% or more, has increased dramatically in recent years relative to the average since 1980.
Moreover, since 2008, an increasingly large share of these large stock movements have been caused by policy-related events.”
This is yet another indicator investors could consider following and is yet another indicator that raises concerns for investors.
Did you know that dividends have rewarded investors for at least 100 years, at least since John D. Rockefeller said, “Do you know the only thing that gives me pleasure? It’s to see my dividends coming in.”
We have prepared a special report about dividends that you can access right here.
