This Year Is Different: It’s Worse Than Many Investors Realize
Many investors believe diversification can help them reduce risks. This phrase, “reduce risks,” does have many possible meanings. But, for many investors reducing risk means minimizing losses. That’s why they trade off higher returns for reduced volatility.
Morningstar, a research firm known for their detailed analysis of mutual funds, explains,
“”Don’t put all your eggs in one basket” is a common expression that most people have heard in their lifetime. It means don’t risk losing everything by putting all your hard work or money into any one place.
To practice this in the context of investing means diversification—the strategy of holding more than one type of investment, such as stocks, bonds, or cash, in a portfolio to reduce the risk.
In addition, an investor can diversify among their stock holdings by buying a combination of large, small, or international stocks, and among their bond holdings by buying short-term and long-term bonds, government bonds, or high-and low-quality bonds.
A diversification strategy reduces risk because stocks, bonds, and cash generally do not react identically in changing economic or market conditions.
Diversification does not eliminate the risk of experiencing investment losses; however, by investing in a mix of these investments, investors may be able to insulate their portfolios from major downswings in any one investment.
Over the long run, it is common for a more risky investment (such as stocks) to outperform a less risky diversified portfolio of stocks, bonds, and cash. However, one of the main advantages of diversification is reducing risk, not necessarily increasing return.
The benefits of diversification become more apparent over a shorter time period, such as the 2007–2009 banking and credit crisis. Investors who had portfolios composed only of stocks suffered large losses, while those who had bonds or cash in their portfolios experienced less severe fluctuations in value.”
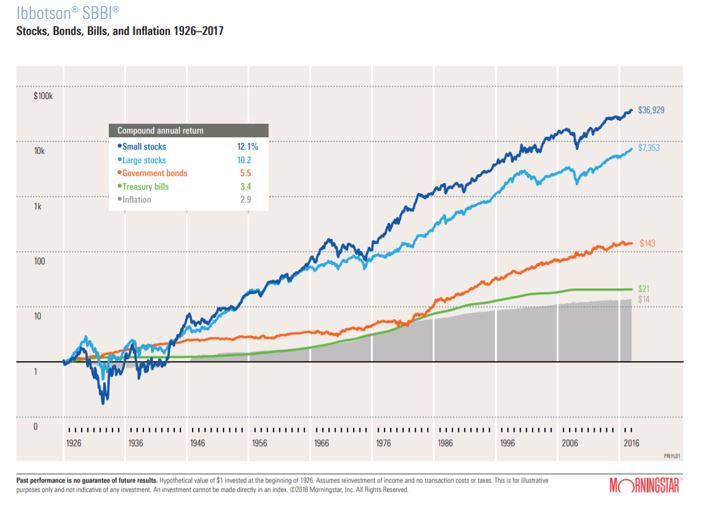
For example, over the long run, studies have shown that small cap stocks are among the best performing asset classes. But that asset also has the highest degree of risk. To reduce the risk, most investors add assets besides small cap stocks to their portfolio.
The chart below highlights the data that requires the trade offs.

Source: Morningstar
Clearly, a 100% investment in small caps would maximize wealth. But the early years shown in that chart demonstrate the risks. A 100% allocation to small cap stocks also would have maximized the largest loss. To reduce the risk of ruin, many investors diversify.
But This Year Is Different
Diversification has worked in the past because there is no reason to expect all, or almost all assets to move in the same direction at the same time. That means lower returns and low risks. But, this year has been unusual.
An article in The Wall Street Journal recently highlighted how unusual this year is.
“Data show global stocks and bonds could both finish the year in the red for the first time in at least a quarter-century, according to BlackRock,” an investment management firm with more than $6 trillion in assets under management.
But, that’s just two asset classes.
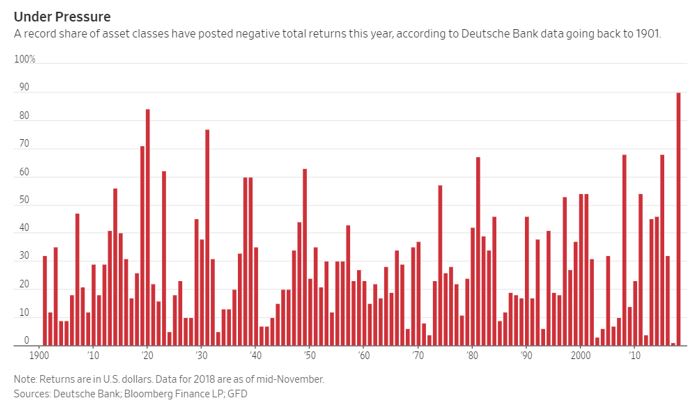
Deutsche Bank tracks 70 different asset classes and 90% of them are posting negative total returns in dollar terms for the year through mid-November. The previous high was in 1920, when 84% of 37 asset classes were negative. Last year, just 1% of asset classes delivered negative returns.

Source: The Wall Street Journal
That makes this year highly unusual. More asset classes are showing losses right now than they did in 1929, the year that included the stock market crash that began the Great Depression. The peak of this data series during the Great Depression was 77% in 1931.
In the most recent bear market, the devastating decline in prices investors experienced in 2008, just 68% of asset classes declined.
What This Could Mean, For Now
Traders are fond of saying that in a crash, all correlations go to 1. Correlation is a mathematical definition of the relationship between two variables. It ranges from -1 to 1 with -1 showing a perfect inverse correlation (when one asset rises the other falls) and 1 shows a perfect correlation.
By saying correlations go to 1 in a crash, traders were noting the difficulty of making money during a stock market crash. That probably comes from their experience of seeing losses in their accounts on days when the market crash.
But, in years past, there were safe havens during crashes. In October 1987, when the Dow Jones Industrial Average fell more than 20% in one day in the largest one day decline in history, bonds went up. That’s not happening this year.
In fact, since the early 1980s, bonds have often moved up when stocks fell. That was largely because we were in a secular bull market for bonds. A secular, or long term, bull market in bonds means that interest rates are generally falling. And, rates fell from the 1980s, until now.
If we are in a rising interest rate environment, we can expect more losses in bonds. That makes the next bear market in stocks potentially different than other bear markets in recent years.
This time is different in that regard and it is different because of the globalization of markets. Hedge funds and other large investors buy and sell stocks all over the world, and many individual investors have the same capability in their accounts at popular discount brokers.
More investors trade foreign exchange now and commodities. These are typically markets where large investors follow trends and down trends will potentially be fueled by these investors in the next bear markets.
This market is different because it moves faster than ever thanks to high frequency trading and it is highly leveraged, in part because of low interest rates that allowed aggressive large investors to borrow at low costs.
These changes could explain why 90% of asset classes show losses this late in the year. This is also evidence that investors must have risk management strategies beyond diversification, potentially including plans for stop losses and other tools.
