Oil Prices Like This Triggered Recessions in the Past

This is an important time for the oil market. And, that means the economy faces a potential tipping point. In the past, spikes in oil prices have led to recessions. This time could be different, but it is always dangerous to assume that history will fail.
However, it is also important to have a firm grasp of what exactly history tells us. In this article, we will do that, after reviewing the current state of the oil market.
Oil Tops $81
The price of oil is rising. There are several different qualities of oil traded in the global market but the benchmark for the market is usually considered to be Brent crude oil.
Brent Crude is a major trading classification of sweet light crude oil that serves as a major benchmark price for purchases of oil worldwide.
This grade is described as light because of its relatively low density, and sweet because of its low sulphur content. Brent Crude is extracted from the North Sea and comprises Brent Blend, Forties Blend, Oseberg and Ekofisk crudes (also known as the BFOE Quotation).
The Brent Crude oil marker is also known as Brent Blend, London Brent and Brent petroleum. The other well-known classifications (also called references or benchmarks) are the OPEC Reference Basket, Dubai Crude, Oman Crude, Urals oil and West Texas Intermediate (WTI).
Brent is the leading global price benchmark for Atlantic basin crude oils. It is used to price two thirds of the world’s internationally traded crude oil supplies.
This week, CNBC reported, “Brent crude breached $81 a barrel on Monday — its highest level in nearly four years — on the back of a tightening oil market and OPEC leaders signaling they won’t be immediately boosting output.”
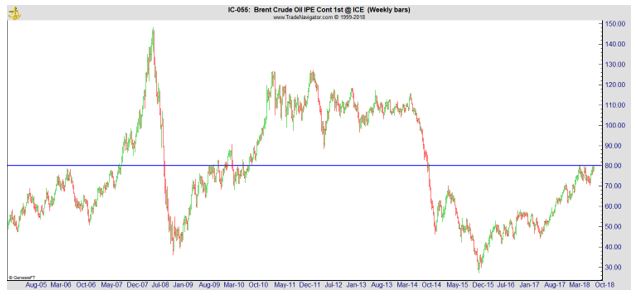
The recent push can be seen in the chart below.

This chart shows that the price rally in 2007 came before the global financial market crash. That leads to concerns when prices rise. This makes it important to look ahead and see if more gains are likely.
Analysts Believe Higher Prices Are Possible
The break above $80 a barrel positions Brent for a breakout, said John Kilduff, founding partner at energy hedge fund Again Capital.
“From there then you could see a greater push higher, really to $83 or $85,” he said. “That should engender follow-through buying.”
J.P. Morgan wrote in its latest market outlook that “a spike to $90 per barrel is likely” in the coming months thanks to U.S. sanctions on Iranian oil exports, which have fallen dramatically in recent months as importers brace for the impending penalties.
The bank forecasts Brent and U.S. benchmark WTI prices to average $85 and $76 per barrel, respectively, in the next six months. WTI is widely traded in the U. S. and is currently at about $70 a barrel
News Points to More Potential Gains
Analysts cite news as a trigger for higher prices.
A meeting of OPEC and non-OPEC oil ministers in Algiers over the weekend concluded with the 15 nation cartel and its allies refraining from an urgent boost in output, despite President Donald Trump’s demands that it work harder to bring down prices.
The ministers said they would increase output only in the event that customers wanted more cargoes. In other words, they want demand to increase before supply which is a recipe for higher prices in traditional economics.
Member countries over the last three months since June have responded in a very good way and have opened the taps and provided a lot of supply to offset decreases in Iran, decreases in Venezuela, decreases in Mexico, and markets are quite balanced today, Saudi oil minister Khalid Al-Falih told CNBC. “There is plenty of supply to meet any customer that needs it.”
But, this comes as the impact of U.S. sanctions on Iran’s oil sector will be deeper than what many have expected, said Peter Kiernan, Lead Energy Analyst at the Economist Intelligence Unit.
“Should cuts to Iranian oil exports end up being quite severe, OPEC will find it difficult to pick up the tab completely,” he told CNBC.
“OPEC insists that the market is still ‘well supplied,’ but the pressure to relax output will heighten if prices continue to rise, adding an interesting dimension to the Trump administration’s efforts to try to isolate Iran by denying it crucial oil revenue.”
The Trump administration has been pressuring its allies to cut their Iranian oil imports down to zero since its decision to withdraw from the Iranian nuclear deal in May. South Korea has dropped its imports to nearly zero, but Japan and Turkey have had little marked decrease in theirs.
India’s imports from Iran in August were actually up 56 percent from the same month last year, due to large discounts offered by the Islamic Republic since the sanctions were announced. A number of Asian countries, major customers of Tehran, have asked for waivers from Washington’s restrictions.
Iran’s oil exports averaged 2.1 million barrels per day (bpd) over the last year, and analysts say sanctions will likely take between 500,000 and 1 million bpd off the market.
A group of about a dozen oil producers led by OPEC has aimed to keep 1.8 million barrels a day off the market since January 2017 in order to drain a global glut of oil that caused a punishing downturn. In June, the participating countries agreed to restore some production after the group’s output fell more than intended.
OPEC and Russia have pledged to increase production to meet any shortfall created by an anticipated fall in Iranian crude oil production, but no official decision has been made yet.
Techncials Point to No Recession
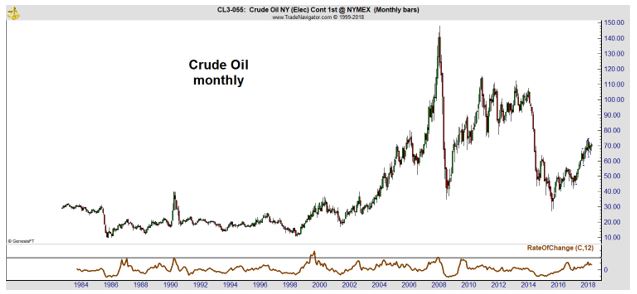
While economists and analysts will debate the likelihood of recession, the chart below shows the trigger is not higher prices. It is the rate of change (ROC) of prices.

The solid grey line shows an annualized ROC of 90%. That level was seen in 1987, in 1990, in 1999 and in 2008. Each of those triggers preceded a bear market. The bear in 1987 was short lived.
That was also the only signal that did not precede a recession. Overall, the ROC is a reliable indicator and is not signaling a problem for now.
