Goldman Sachs Says It’s Time to Worry
Many investors worry all the time. Many analysts urge investors to worry all the time. It feels as if some analysts have been bearish since at least 1987, warning of an impending market crash like the unprecedented one that we saw in October of that year.
These analysts have been pessimistic for so long there is even a name for them. They are called perma-bears because of their permanently bearish stance. Because they are so widely quoted in the financial media, when other analysts make bearish calls, the news can be lost in the noise.
Recently Goldman Sachs announced reasons that investors should worry, and that is news that should not be ignored.
Goldman Is Important in the Markets
The firm was famously profiled by Matt Taibbi in Rolling Stone:
“The first thing you need to know about Goldman Sachs is that it’s everywhere.
The world’s most powerful investment bank is a great vampire squid wrapped around the face of humanity, relentlessly jamming its blood funnel into anything that smells like money.
In fact, the history of the recent financial crisis, which doubles as a history of the rapid decline and fall of the suddenly swindled dry American empire, reads like a Who’s Who of Goldman Sachs graduates.”
Now, we don’t need to believe that the firm is a “great vampire squid wrapped around the face of humanity” but we should understand that Goldman is everywhere and when the company’s analysts express concerns, they should be listened to.
The firm started sounding the alarm weeks ago.
CNBC reported that, “Goldman’s ‘bear market risk indicator’ signals returns will be zero the next 12 months:
Goldman Sachs’s bear market prediction tool is at an “elevated” level that has historically signaled a zero average return over the next 12 months and a “substantial” risk of drawdown.
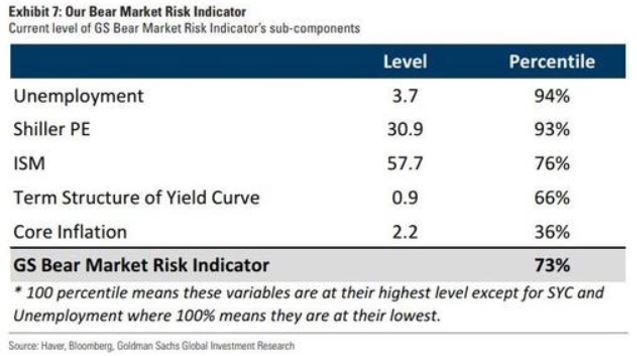
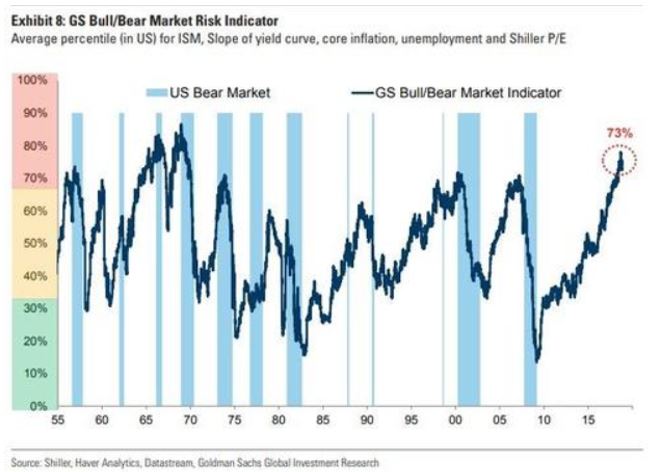
Goldman’s bear market indicator — which takes into account the unemployment rate, manufacturing data, core inflation, the term structure of the yield curve and stock valuation based on the Shiller PE ratio — is at a rare 73 percent, its highest level since the late 1960s and early 1970s.
The indicator is “flashing red,” wrote Goldman chief global equity strategist Peter Oppenheimer.
“Historically, when the Indicator rises above 60 percent it is a good signal to investors to turn cautious, or at the very least recognize that a correction followed by a rally is more likely to be followed by a bear market than when these indicators are low.”

Source: ZeroHedge
To arrive at the value of the indicator, Goldman aggregated these variables in a signal indicator, and took each variable and calculated its percentile relative to its history since 1948. The indicator over time is shown in the next chart.

Source: ZeroHedge
Specific News to Watch
In addition to the bear market indicator, Goldman analysts monitor a variety of other indicators and news events. The firm generates a variety of forecasts and has access to an array of data. A review of those forecasts allowed the firm to identify six specific headwinds for the stock market:
- S. real GDP growth slows from 2.9% in 2018 to 1.6% in 2020
- China’s real GDP growth slows from 6.6% in 2018 to 6.1% in 2020
- S&P 500 earnings growth slows from 23% in 2018 to 8% in 2019
- Core inflation rises from 1.9% in 2018 to 2.2% in 2019-20
- 10-Year U.S. Treasury Note yield hits 3.5% in second half of 2019
- S. unemployment rate drops to 3.2% in 2019, creating more wage pressures
A slowing U. S. economy will reduce corporate profits and the stock market is likely to decline in reaction to that.
New reports in Investopedia summarized the importance of China’s slowdown:
Because China has become the world’s second-largest economy next to the U.S., and since it is a major buyer of goods and services offered by U.S. corporations, an economic slowdown there has major negative ramifications for U.S. companies, as well as for the overall U.S. economy.
Goldman projects real, inflation-adjusted, GDP growth rates in China to remain relatively strong in 2019 and 2020, at 6.2% and 6.1%, respectively. However, this is on a decelerating path, having been 6.9% in 2016 and 6.6% in 2017.
Increasing trade tensions between the U.S. and China are a related source of concern, as China has responded to U.S. tariffs on its goods by retaliating in kind.
“A major trade war would lead to a significant reduction in growth,” Bank of America Merrill Lynch warned in a note to clients during the summer, as quoted by CNBC. “A decline in confidence and supply chain disruptions could amplify the trade shock, leading to an outright recession,” the note added.
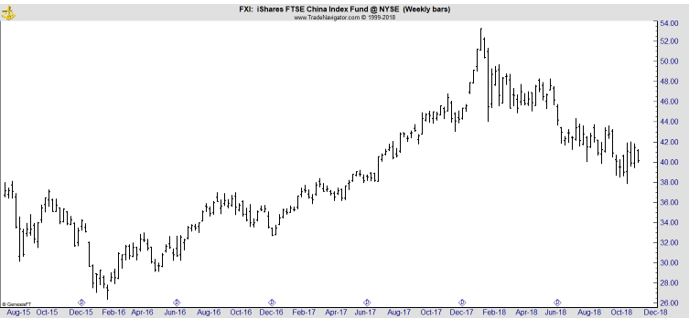
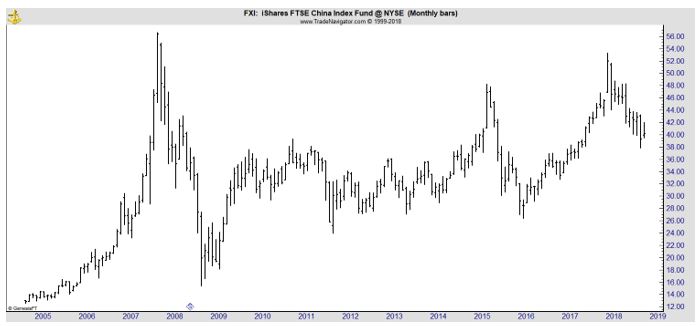
A slower pace of growth in China would also explain the recent weakness seen in that stock market. The chart of iShares FTSE China Index Fund (NYSE: FXI) is shown below. This is a way for U. S. investors to invest in the market and FXI is trading well below its highs in its own bear market.

Now, it is possible for U. S. stocks to rally when Chinese stocks are weak. In fact, the bull market rally in the U. S. came as stocks in China have failed to recover their bull market highs.

But, headwinds in the Chinese economy will threaten economic growth in the U. S. and it is the concern of a recession that is causing the headwinds for stocks.
As Goldman notes, inflation and interest rates are rising as cost pressures are building for U. S. companies. Earnings growth is slowing, and it simply must slow after the sharp rise that occurred after the passage of tax reform.
This all points to a drop in investor expectations for growth and a lower valuation of the stock market, which comes with the stock market at a high level of valuation. Investors should expect a lower price to earnings (P/E) ratio and a decline in stock prices as that metric resets.
For now, caution is warranted. It could be an ideal time to take profits or to recognize losses if that is a prudent tax planning strategy. It’s likely to be a sub-par year for stocks if Goldman is right, and the firm has a reputation for being right quite often.
