Be Sure You Have Realistic Expectations
Millennials are more optimistic than perhaps many realize. At least that’s the case when it comes to their personal finances. Or, maybe instead of calling their financial plans optimistic they might be thought of as unrealistic.
This is a generation that news reports frequently cite as drowning in student load debt. Yet, according to CNN,
“According to survey results out Monday from TD Ameritrade, about half of people between the ages of 21 and 37 expect to eventually become millionaires (or already are).
The brokerage firm sponsored a survey earlier this year that asked roughly 1,500 American millennials at what age, if any, they thought they would officially earn that label. 53% of respondents said they believed they’d become millionaires in their lifetimes, with about 7% predicting it would happen by the time they turned 30, 19% by age 40 and 16% by age 50.
7% of people said they’d be millionaires by 60 or later. A small part of the group, about 4%, said they were already millionaires.”
While more than half of millennials expect to become millionaires, just about 5% have historically achieved that level of success.
“In its annual report on the state of global wealth, Credit Suisse says 1.1 million new millionaires were created in the U.S. in 2017. That brings the total number of millionaires in the U.S. up to approximately 15,356,000, or about one in every 20 Americans.
The rise in the stock market is the biggest reason for the gains, which in turn were driven by both stronger underlying economic conditions and the prospect of lower taxes and deregulation, Credit Suisse reported.
“Wealth per adult has now fully recovered [from financial crisis lows], and is 30% above the 2006 level,” the bank says. “There is some uncertainty about future interest rates and stock market prospects, but otherwise the signs are mostly positive for household wealth.”
And, the study noted, “the U.S.’s median wealth of $55,876 puts it 21st place in the world, alongside Austria and Greece.”
In the original CNN report, experts noted that the expectations could be due to several factors.
“TD’s chief market strategist, JJ Kinahan. Kinahan tells MONEY that the results can be attributed to “youthful exuberance” and the plethora of success stories coming out of Silicon Valley, where employees often receive stock options as part of their compensation packages.”
And, the math says it is possible.
“Say you’re a 25-year-old living in Iowa, where the median millennial income is about $63,000, according to a recent MONEY analysis. Assume you follow the national standard and start contributing 6.2% of your salary to your 401(k), with your employer matching 50% up to 6% of your salary.
Even if you only get annual salary increases of 2.3% — which is below the U.S. average — you can still have $1,004,468 by the time you retire at 65, assuming annualized market returns of 5%.”
All it takes is savings and time, or luck. But, perhaps the goal should be financial security and for this, it can be useful to consider what type of returns are possible.
Realistic Rates of Return
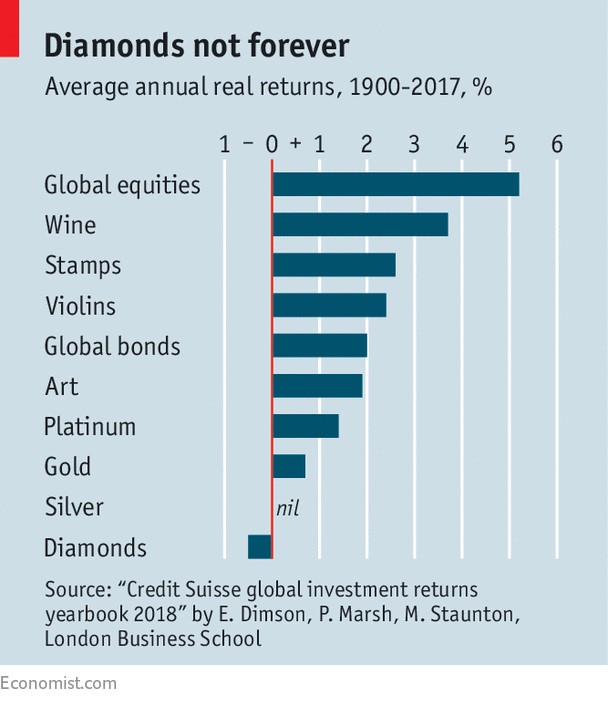
The Economist notes that returns in the long run might not be as rewarding as some of these individuals may believe.
“In the long run, equities have been the best-performing asset class, with a global real return of 5.2% since 1900. But that does not mean investors should assume those high returns will continue.
The prospective return on shares is equal to the real return on riskless assets (such as T-bills) plus a risk premium. That premium is now around 3.5% a year, the LBS trio think. As the real return on T-bills is currently negative, that suggests a real return on equities of around 3%.
The LBS academics made a similar forecast about low returns in 2000. The real return on shares since then has been 2.9%. If the professors are right again, more investors will be tempted by Bordeaux and Bugattis.”

Source: Economist.com
These are the rates of returns for the very long run, a period or 117 years which exceeds the lifetime of an individual. For individual returns, there is an element of luck.
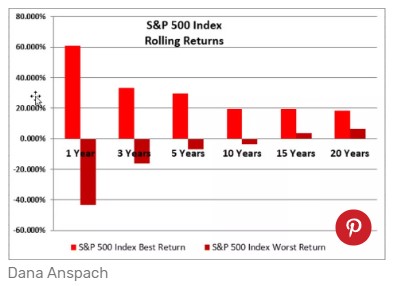
The chart below shows the best and worst stock market returns over several time periods.

Source: TheBalance.com
This chart shows rolling returns. Rolling returns do not go by the calendar year; instead, they look at every one year, three year, five year, ten year, fifteen year and twenty year time period beginning with a new period each month over the historical time frame selected.
Rolling returns give you a great picture of how the stock market performs over both good and bad times. You don’t get this complete view when you look only at average returns. The average smooths out the ups and downs.
In the chart above, one year returns ranged between a gain of about 60% and a loss of 40%. This is the reason why many financial advisers urge investors to focus on the long run. In the fifteen year rolling periods, the lowest return was always a gain.
Focusing on longer periods, the worst twenty years delivered a return of 6.4% a year. This occurred over the twenty years ending in May 1979. The best twenty years delivered an average return of 18% a year, which occurred over the twenty years ending in March 2000.
There is an important lesson in that last piece of information. Notice that the best twenty year return came after the worst twenty year return. This demonstrates that stock prices tend to be mean reverting over the long run.
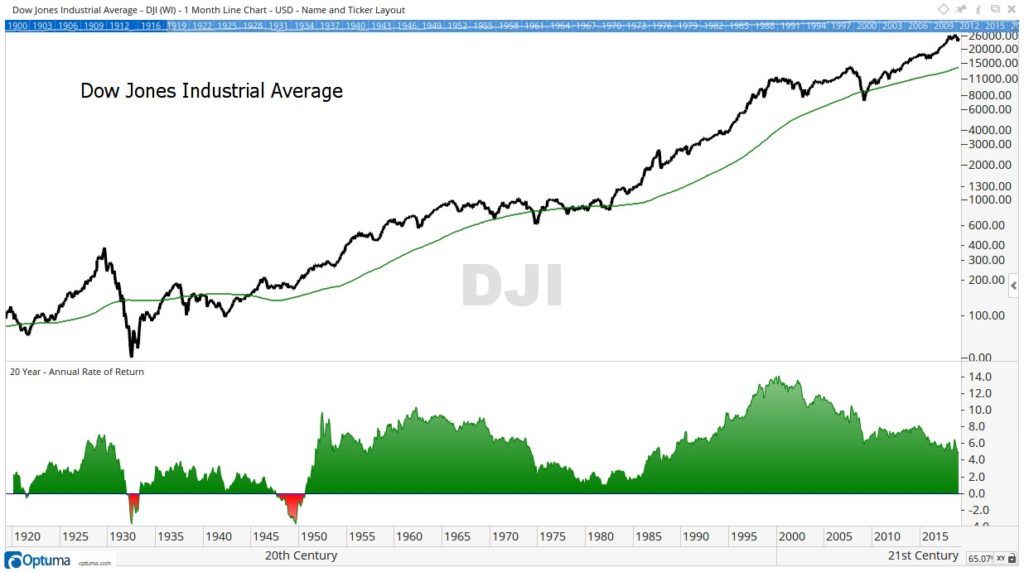
That leads to the question of where we are now. The chart below uses the Dow Jones Industrial Average to provide a long term view which does show there have been losses in the past.

Even long term investors experienced losses in the 1920s, 1930s and 1940s. The current level of average returns is falling and is actually just below its long term average.
Over the past 100 years, the average 20 year rolling return has been 5.3%. The most recent value is 4.8%. This means a bottoming process is likely underway. However, that most likely means years of returns averaging less than 10%, the common target for many investors.
This all means many individuals will not be millionaires if they follow the usual strategies. They will need to look at alternative investment strategies to meet their goals if history is a guide.
Did you know that dividends have rewarded investors for at least 100 years, at least since John D. Rockefeller said, “Do you know the only thing that gives me pleasure? It’s to see my dividends coming in.”
We have prepared a special report about dividends that you can access right here.
