
The Future Looks Scary for Investors
Investors might be disappointed in the future. At least that is likely to be the case if Dr. Phil is correct. The popular psychologist is fond of noting “The best predictor of future behavior is relevant past behavior.”
For investors, this does mean that there are reasons to expect patterns seen in the past to at least hold partly true in the future. Many analysts apply this philosophy to develop long term forecasts of stock market returns.
Many long term models apply mathematical models based on mean reversion.
In finance, according to Wikipedia, “mean reversion is the assumption that a stock’s price will tend to move to the average price over time.
Using mean reversion in stock price analysis involves both identifying the trading range for a stock and computing the average price using analytical techniques taking into account considerations such as earnings, etc.
When the current market price is less than the average price, the stock is considered attractive for purchase, with the expectation that the price will rise. When the current market price is above the average price, the market price is expected to fall.
In other words, deviations from the average price are expected to revert to the average.
Stock reporting services commonly offer moving averages for periods such as 50 and 100 days. While reporting services provide the averages, identifying the high and low prices for the study period is still necessary.”
This method can also be applied to fundamental data including price to earnings (P/E) ratios.
One Model Suggests Lower Than Average Gains Ahead
One research firm that takes that approach is Crestmont Research, a firm that “develops provocative insights on the financial markets, including the stock market, interest rates, and investment philosophy.
The research focuses on the drivers and characteristics of secular stock market cycles, the impact of the inflation rate and interest rates on the stock and bond markets, and a conceptual approach toward investment strategy that is applicable to the current market environment.”
One study is called “Gazing at the Future” and notes,
“The starting valuation matters! When P/Es start at relatively lower levels, higher returns follow — paying less yields more. When investors have P/Es that start higher, subsequent returns are lower.
This graphical analysis presets the compounded returns that follow over the subsequent ten years based upon the starting P/E ratio. It’s compelling, primarily because it’s fundamental — starting valuations directly impact subsequent returns. From the current above-average valuations, below-average returns are likely to follow for the next decade or longer.”
The current state of this model is shown in the chart below.
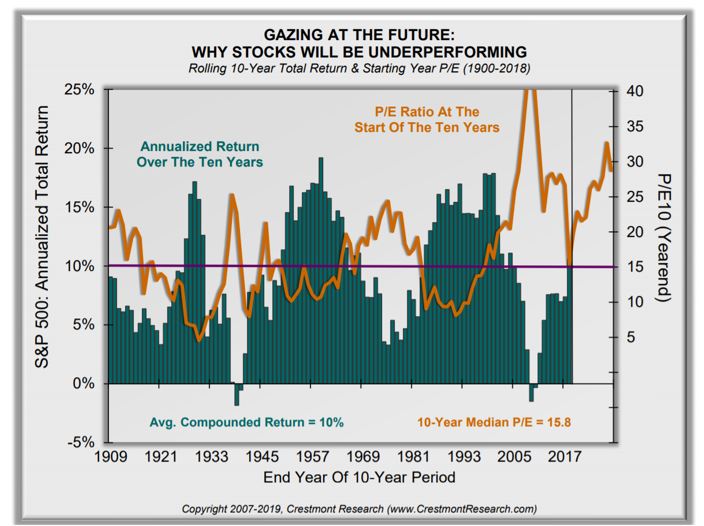
Source: Crestmont Research
This chart tells us the past ten years were good for investors but the next ten might not be as favorable. P/E ratios at this level have generally been associated with lower than average long term returns.
Another Model Quantifies How Bad It Could Get
Another firm that provides forecasts is GMO, a global investment management firm committed to providing sophisticated clients with superior asset management solutions. This firm manages billions of dollars and follows a value based approach to the markets.
GMO regularly publishes a seven year asset class real return forecast from GMO. It was fairly accurate and useful from 2000–2007. Looking back from 2010, the GMO forecast was not as accurate or useful about future potential returns. This could be due to changes in central bank policies.
The GMO model assumes some mean reversion. Looking ahead, the model expects negative returns large cap stocks in the U. S., an average annual loss of about 2.5% is expected over the next seven years. Small caps are expected to do a little better with an average annualized gain of about 1.3% in the forecast.
GMO expects value stocks in emerging markets to be the best performing asset class with the potential to deliver an average annual return of about 8.2%.
A Look at Broad Asset Classes
Research Affiliates, LLC, is a global leader in smart beta and asset allocation. The firm’s investment strategies are built on a strong research base and are led by Rob Arnott and Chris Brightman. As of December 31, 2018, $170 billion in assets are managed worldwide.
RA also prepares models that show expected long term returns of asset classes. The full model is shown below.
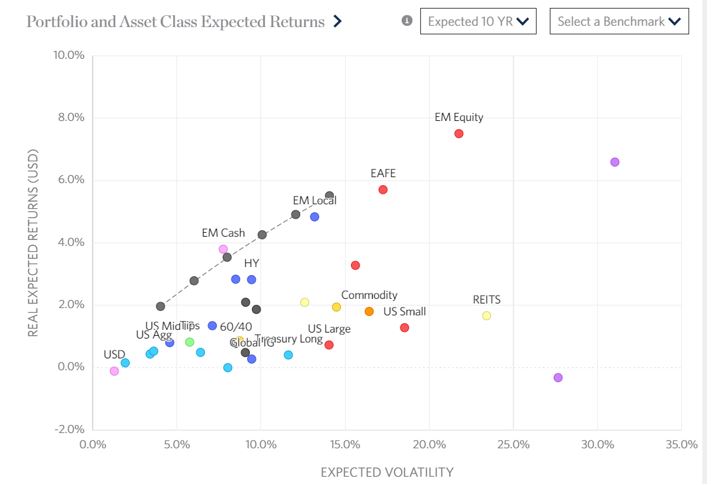
Source: Research Affiliates
The next chart highlights stocks and gives investors cause for concern.
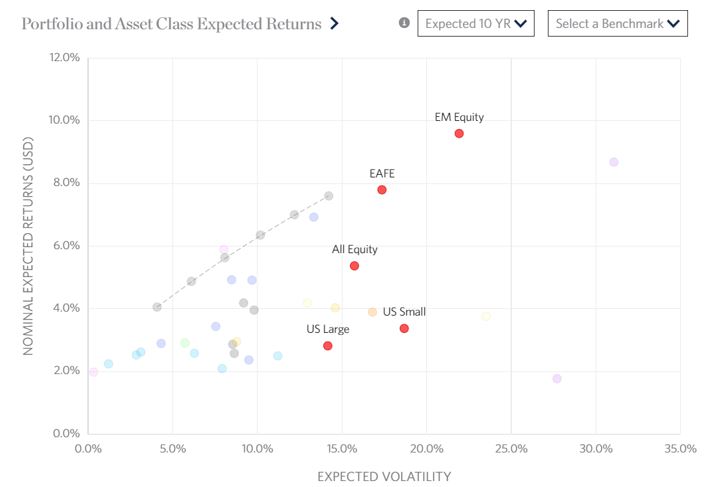
Source: Research Affiliates
The firm explains, “Equity expected returns are based on the Gordon Growth Model which focuses on dividend yield and price appreciation earned from a growth in cash flows such that yield remains constant over time. This return perspective can be seen by switching the ‘Model’ to Yield + Growth.
As a default, our return model is valuation aware and also includes modeling of time varying discount rates based on the CAPE ratio measuring prices versus 10-year average real earnings. The level of the CAPE when compared to fair value, or in our case a blended historical average across countries, can inform if markets are overvalued, fair valued or undervalued.”
Overall, there is reason to be concerned. Crestmont, GMO and RA all agree that below average returns are likely. GMO is the most pessimistic and RA’s research suggests that gains of less than 4% are likely.
GMO and RA agree that emerging market stocks are likely to be the strongest performers, and this could be useful information for investors to consider. Now could be an ideal time to consider investing in emerging markets or increasing exposure to those markets.
The outlook for bonds is also below average and investors should not count on a diversified model to help them escape the expected low returns of the next few years. It is also important to remember that these models suggest average returns, and there will be some stocks that deliver returns that are well above average.
Of course, these models could all be wrong. That is possible but investors should not hope that they are. They should accept that what worked in the past ten years may not work as well in the next ten years and they should consider other strategies.
Did you know that dividends have rewarded investors for at least 100 years, at least since John D. Rockefeller said, “Do you know the only thing that gives me pleasure? It’s to see my dividends coming in.”
We have prepared a special report about dividends that you can access right here.
