Retail Sales Raise Flags for Investors
Many investors and analysts closely watch economic data. The most recent data on retail sales caused many to question the health of the economy.
Investopedia explains what the report is and why it is important:
“The Retail Sales Report, released monthly by the U.S. Census Bureau, is very closely watched by both economists and investors. The Census Bureau has been releasing the report since 1951 and they adjust the sample of retail outlets used every five years to stay current.
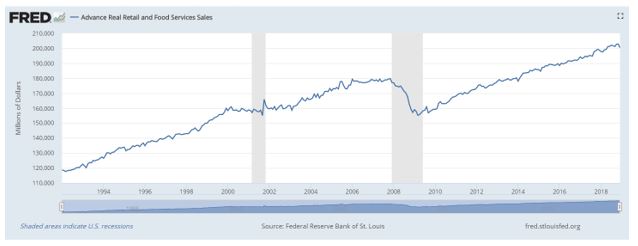
Source: Federal Reserve
This indicator tracks the dollar value of merchandise sold within the retail trade by taking a sampling of companies engaged in the business of selling end products to consumers. Both fixed point-of-sale businesses and non-store retailers (such as online sellers) are used in the data sample.
Companies of all sizes are used in the survey, from Wal-Mart to independent, small-town businesses. These companies provide data including retail sales and month-end inventories.
The data from the Retail Sales Report is widely used by various government agencies, academic analysts and researchers, economists, businesses and investors. It is a component in the calculation of Gross Domestic Product, a key economic indicator.
The Fed uses this data to analyze recent trends in consumer purchases as part of their overall analysis of the economy and recent trends. The results of the report are widely reported by the financial media.
Investors use the data to measure trends in consumer spending as part of their overall analysis of business and economic trends, and of industries impacted more directly by this data.
The release of the Retail Sales Report can cause above-average volatility in the stock market. Its clarity as a predictor of inflationary pressure can cause investors to rethink the likelihood of Fed rate cuts or hikes, depending on the direction of the underlying trend.
If retail sales growth is stalled or slowing, this means consumers are not spending at previous levels, and could signal a possible recession due to the significant role personal consumption plays in the health of the economy.
One of the most important factors investors should note when viewing the indicator is how far off the reported figure is from the so-called consensus number, or “street number.”
In general, the stock market does not like surprises, so a figure that is higher than expected could trigger selling of stocks and bonds, as inflationary fears would be deemed higher than expected.”
The Latest Data
MarketWatch summarized the most recent report and highlighted a potential problem in the data:
“The Commerce Department on Thursday said retail sales slumped 1.2% at the end of 2018, marking the biggest decline in nine years. Virtually every retail segment suffered, including high-flying internet retailers.
At least that’s what the initial government estimate showed. Many economists don’t believe it.
“There’s no denying retail sales are weaker, but they are not this weak,” asserted chief economist Richard Moody of Regions Financial. Moody regularly tells investors to ignore preliminary retail sales figures because they are so often heavily revised.
He is far from alone. Most economists say investors should treat the December retail report cautiously.
“This release is such an outlier and so incongruous with the general trend in consumer spending, holiday consumer sales reports and holiday seasons consumer credit data that it does raise suspicions of data reliability,” said Ward McCarthy, chief financial economist at Jefferies LLC.
One big red flag, for example, was a reported 3.9% decline in sales among internet retailers. The last time internet sales fell that much was in 2008 at the height of the last recession.”
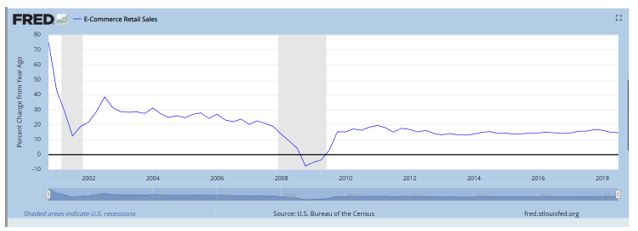
Source: Federal Reserve
Yet by all accounts, Amazon and other internet retailers posted very strong sales and had one of the best holiday seasons in years.
What Gives?
Moody points to the government’s effort to “adjust” sales figures for season variations . The goal is to smoothen out the retail numbers so they don’t show huge changes from one month to the next, giving investors a clearer idea of sales trends in the economy.
Seasonal adjustments are used in most government reports and widely accepted by the economics profession, but sometimes they can throw a report out of whack. Many economists think that’s what happened in December.
Consider internet retailers. Their sales actually rose 10% in December, the government’s raw or unadjusted numbers show. Yet they had been rising in December in recent years at a 25% rate.
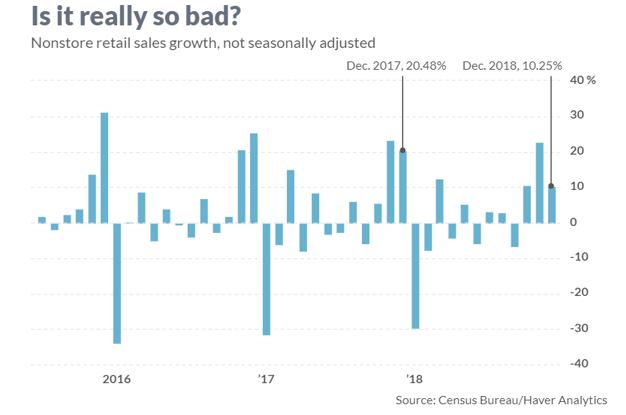
Source: MarketWatch.com
When the government applied its seasonal adjustments, the increase in internet sales became a decrease. That happened throughout the report.
Other factors may have also been at work.
The stock market plunged in December and sparked fresh talk of a recession. The partial government shutdown began a few days before Christmas. And an unusual bout of cold weather struck large swaths of the country.
There’s little doubt, economists say, the U.S. economy slowed toward the end of 2018. They just don’t think retail sales truly cratered and took the economy with it.
“Before succumbing to panic and despair, we would suggest waiting to see what the January and February data have to say about the state of the consumer,” wrote chief economist Joshua Shapiro of MFR Inc. in New York.”
Barron’s also cited a problem with the report, “Philippa Dunne and Doug Henwood, who pen the TLR on the Economy advisory, point out the monthly retail sales release is perhaps the most revised report to come out of the government’s statistics mill. Even so, it was a shocker.
Previously, Barron’s had cited the importance of retail sales:
“According to a recent research note from Goldman Sachs , the wealth of, and spending by, not just the very wealthiest Americans but also middle- and upper-middle-income households have become tied more closely to the stock market.
That’s contrary to the standard economic assumption that the “wealth effect” from moves in stock prices should be diminished since so much equity wealth is now in the hands of the tippy-top, who can readily absorb a hit from a bear market without cutting back.
The wealthiest 0.1% of households account for 17% of the stockholdings of all households, while the top 1% own 50%, according to Goldman’s parsing of Fed data on consumer finances. Those percentages are up from 13% and 39%, respectively, in the late 1980s.
Relative to their incomes, all households’ stockholdings have tripled. As a result, for the top 10%, the impact of a 1% drop in equity prices is now three times as large as it was in the late 1980s, according to Goldman.
Even for the upper middle-class (those in the 50th-90th percentiles), the impact of stock price declines is one-third greater. As a result of an 11% decline in equities from their September peak until Jan. 15 (the date of the report), Goldman economists expect 2019 gross-domestic-product growth to decline by 0.5 of a percentage point.”
Because retail is so important to the economy and the stock market, investors will be watching revisions to the data closely.
Did you know that dividends have rewarded investors for at least 100 years, at least since John D. Rockefeller said, “Do you know the only thing that gives me pleasure? It’s to see my dividends coming in.”
We have prepared a special report about dividends that you can access right here.