Stock market strategies

This Market Expert Says Be Careful With Yields

Mortgage real estate investment trusts, or mREITs, help provide essential liquidity for the real estate market. mREITs invest in residential and commercial mortgages, as well as residential mortgage backed securities (RMBS) and commercial mortgage backed securities (CMBS).

mREITs typically focus on either the residential or commercial mortgage markets, although some invest in both RMBS and CMBS.

REITs hold mortgages and MBS on their balance sheets and fund these investments with equity and debt capital. Their general objective is to earn a profit from their net interest margin, or the spread between interest income on their mortgage assets and their funding costs. mREITs rely on a variety of funding sources, including common and preferred equity, repurchase agreements, structured financing, convertible and long term debt and other credit facilities. mREITs raise both debt and equity in the public capital markets.

mREITs typically use less borrowing and more equity capital to finance their acquisitions of mortgages and MBS than do other large mortgage investors.

There are dozens of publicly traded mREITs and some offer double digit yields. But one expert is warning that those yields could be at risk.

mREITs

Source: REIT.com

An Expert Worth Listening To

James Grant founded Grant’s Interest Rate Observer, a twice monthly journal of the financial markets, in 1983. He has been involved in interest rate markets since the late 1960s.

James Grant Photo

Source: Grant’s Interest Rate Observer

Grant’s books include three financial histories, a pair of collections of Grant’s articles and three biographies.  Grant is a 2013 inductee into the Fixed Income Analysts Society Hall of Fame. He is a member of the Council on Foreign Relations and a trustee of the New York Historical Society.

His opinion is widely followed on Wall Street and his recent column in Barron’s carried an important warning for investors on Wall Street and Main Street.

His conclusion is an honest assessment of one mREIT in particular but applies to the entire sector and to the enter world of finance, “So that 12% yield is a hope—a not unreasonable one, but, still, a hope.”

The warning is that high yields should be considered a sign of hope rather than a source of steady and safe income. In fact, the higher the yield, the less the income should be assumed to be.

A Specific Investment of Hope

Grant was writing about AGNC Investment (Nasdaq: AGNC). This REIT has not been around long enough to include an environment when interest rates were normal. It has performed very well since 2009, but many investment opportunities can claim that as an accomplishment.

AGNC monthly chart

AGNC invests mainly in 30 year federal agency mortgage backed securities. It is the second largest mREIT behind Annaly Capital Management (NYSE: NLY). NLY has a longer track record and did experience the 2009 bear market when it fell 48%, after dividends are considered.

NLY monthly chart

Over the past ten years, AGNC delivered a total return of 368% while the larger NLY gained 148%, both values assume that dividends are reinvested.

Grant writes that, “Nobody guarantees that 12% yield. It depends on the skill of the manager, the shape of the yield curve, the perceived direction of Federal Reserve policy, and the propensity of encumbered American homeowners to refinance their mortgages.

It’s the latter consideration, especially, that can turn the unassuming mortgage backed security into a kind of options bomb.

Even so, lots can go wrong—across the mortgage REIT industry, lots does go wrong. AGNC uses $9 of debt for every $1 of equity. The cheaper the cost of its liabilities in relation to the yield on its assets, the better it is for its dividend recipients.

But while, in the fourth quarter, the yield on AGNC’s assets rose by eight basis points—each equal to 1/100th of a percentage point—the cost of the corresponding liabilities jumped by 21 basis points.

Interest rates can get you coming and going. As of Dec. 31, interest rate hedges covered 94% of AGNC’s funding liabilities. Yet the fourth quarter delivered an 8% decline in tangible book value per share and a net loss of $1.61 per share.

Since the third quarter of 2016, tangible book value per share has dropped by 22%. At today’s price of $17.98, the stock changes hands at 103% of that diminished book.

The very nature of mortgage backed securities makes for trouble—they must be, by far, the most perverse securities in the bond market. When rates fall, mortgagors refinance and AGNC’s appreciating assets get called away.

Symmetrically, when rates rise, prepayments plummet and AGNC’s depreciating assets stubbornly stay put. MBS leave when you want them to stay and stay when you want them to leave. “Negative convexity” is the polite term for this confounding mortgage characteristic.

Since AGNC and its ilk are, in effect, short interest rate volatility, a nice, steady positively sloped yield curve is how they thrive. Volatility throws their rate hedges out of sync and plays ducks and drakes with the duration, or interest rate sensitivity, of their portfolios.”

AGNC management notes that, “If interest rates are going up, and our portfolio is getting longer, I have to sell bonds to shorten our duration or I have to pay on interest rate swaps, and I will be doing that at higher yields or lower prices.

Conversely, I have to add duration to the portfolio if interest rates rally [i.e., decline] significantly, and there is a cost associated with buying high.

In a sense, the worst case scenarios are big moves back and forth. Not small moves—10, 15, 20 basis points (we’re not going to do much rebalancing with those) but down 50 basis points, up 50 basis points, back and forth.

You’d end up spending a fair amount of money rebalancing your portfolio if those moves were quick and often.”

This indicates that AGNC performs best when interest rates are on a steady path. That has largely been the case since 2008. But in recent months Federal Reserve policy has become less certain and that could create a worst case scenario for AGNC and other mREITs.

Now might be a good time to limit exposure to the highest yielding investments since the high yield, as Grant notes, is a sign of hope and hope is rarely, if ever, a good investment strategy.


Did you know that dividends have rewarded investors for at least 100 years, at least since John D. Rockefeller said, “Do you know the only thing that gives me pleasure? It’s to see my dividends coming in.”

We have prepared a special report about dividends that you can access right here.

Stock market

This Might Be the Best Way to Look at Boeing as an Investment

When it comes to corporate disasters, the thought of Boeing may be on the mind of many investors.

Boeing’s brand-new fleet of 737 Max aircraft was grounded in over 40 countries after a deadly plane crash in Ethiopia, the second 737 Max to go down in five months, according to The New York Times.

“There’s no hard evidence that the planes have anything wrong with them, but similarities between the two crashes caused widespread concern among aviation officials (and passengers) around the world.

Boeing has promised a software fix and new training program for pilots by April, but it may take a lot longer to repair the damage to its reputation and its bottom line, considering the 737 Max was its best-selling jet ever.”

The stock has sold off on this news.

BA daily chart

History Shows a Possible Precedent

This isn’t the first time Boeing (NYSE: BA) has faced a problem that involved grounding of its planes.

“Boeing’s Dreamliner was grounded in 2013,” The New York Times noted and “it took more than $20 million and three months to fix the problem. The crisis over its 737 Max jet could be even harder to manage, given the incalculable reputational risk after two fatal crashes.

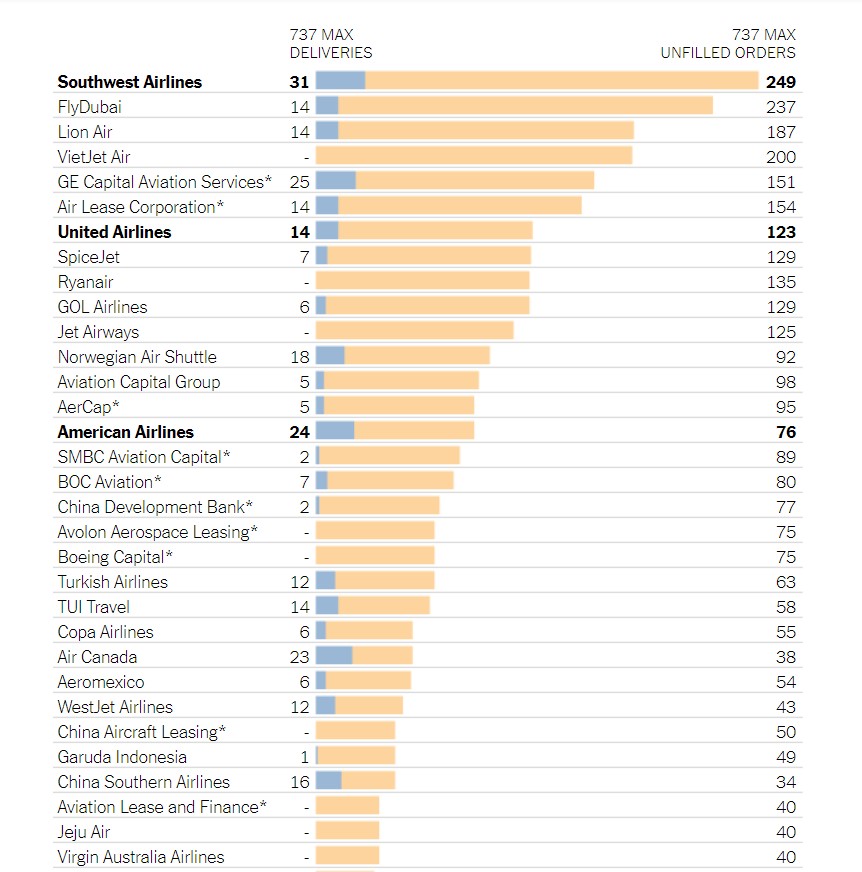
The short-term costs such as a software fix to the plane are likely to be manageable for Boeing, but the bigger financial unknown is whether airlines lose confidence in the Max, the company’s best-selling jet. Some 4,600 planes are on order, accounting for around $550 billion in future revenue.

A partial list of customers is shown below.

partial customer list

Source: The New York Times

“Reputationally and financially, this is painful,” said Richard Aboulafia, vice president of analysis at Teal Group Corp., a consulting firm.

With all of the Max planes now grounded around the world, Boeing’s first priority is developing a fix. Boeing has been working with American regulators to roll out a software update and new training guidelines in the months since the first crash, off Indonesia in October. The update is expected by April, but a final solution could take more time depending on what investigators determine happened in the Ethiopia disaster.

The longer it takes to find a solution, the higher the price tag. The battery fix for the Dreamliner jets amounted to $465,000 per plane, according to Carter Copeland, an analyst at Melius Research. Based on those costs, he estimates that Boeing could spend nearly $1 billion to resolve issues with the 737 Max fleet.

Airlines, which have 350 of the planes in their fleets, have also begun to demand compensation for their losses during the grounding. It costs an estimated $1 million to lease a replacement jet for three months.

“It’s quite obvious that we will not take the cost related to the new aircraft that we have to park temporarily,” said Bjorn Kjos, the chief executive of Norwegian Air, which had to take 18 of the planes out of service after an order from European regulators on Tuesday. “We will send this bill to those who produce this aircraft.”

Boeing could also face lawsuits from the families of passengers who died in the disasters. The Dreamliner had battery problems but never crashed.

Handling the Problem as a Corporation

A company the size of Boeing will probably be able to absorb such costs. Boeing, an aerospace giant that builds commercial and military aircraft, makes more than $100 billion in revenue a year.

The bigger challenge for Boeing is how it will handle future orders. If deliveries are delayed because the plane needs to be redesigned, the manufacturer is likely to have to offer discounts to carriers with orders.

There is also a broader risk that, if the passenger backlash to the Max lasts, the manufacturer could lose some corporate customers in the long run. Such a shift would give an advantage to its European rival Airbus, which makes a similar fuel-efficient plane, the A320neo.

But it’s unlikely that airlines will cancel their Max purchases outright. Carriers typically put down a deposit of around 20 percent for their orders on the $120 million plane, which is paid out over time. It can be difficult to get out of those commitments without solid evidence that there’s a structural problem with the aircraft, airline executives and analysts said.

Even if customers could walk away from their Boeing orders without losing money, they probably wouldn’t. The aircraft manufacturing business is essentially a global duopoly. And Airbus has a yearslong backlog.

“I don’t think anyone will abandon them,” said Jonathan G. Ornstein, the chief executive of Mesa Airlines, who operated a fleet of 737s in his previous role at the helm of Virgin Express, a European airline. Mr. Ornstein called Boeing “customer-centric” and said he expected that the company would bend over backward to maintain its rapport with carriers.

The Problem for Investors

While the company faces problems, so does the stock. Again, investors could look to precedent. As Barron’s explained,

“Boeing Gets Two Orders for 737-400,” read a short item in the Seattle Times in March 1990.

Looking back, it illustrates how even dire news can eventually fade. There was no mention that the plane was coming off two deadly crashes during its first full year of service. In January 1989, a British Midland plane crash-landed onto a highway embankment, killing 47 of 126 aboard.

That September, a USAir flight skidded off a LaGuardia airport runway into the East River of New York, killing two of 63.

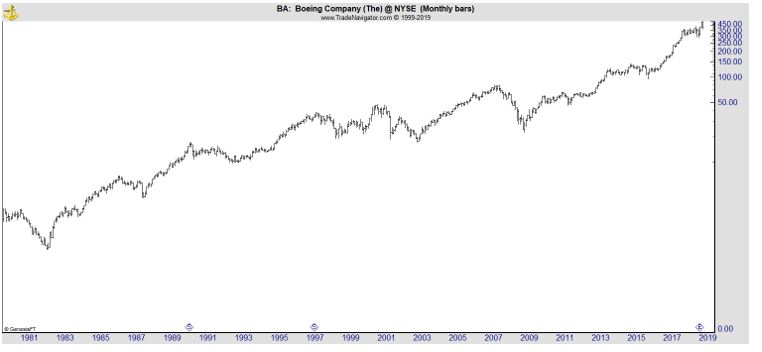
Six months after the second accident, Boeing stock was 20% higher. Both crashes involved pilot error linked in part to unfamiliarity with the 737-400, but both also resulted in the company making changes to the plane.

Orders continued apace for a decade. As of last summer, there were more than 250 of the planes still in service.”

That incident is now lost in the chart.

BA monthly chart

The same pattern could repeat itself. Boeing is unlikely to go out of business as one of the world’s few suppliers of aircraft. That means the stock could be worth watching as a potential buy in the coming weeks or months.


Did you know that dividends have rewarded investors for at least 100 years, at least since John D. Rockefeller said, “Do you know the only thing that gives me pleasure? It’s to see my dividends coming in.”

We have prepared a special report about dividends that you can access right here.

Stock market

This Obscure Indicator Can Help You Beat the Market

Many investors use indicators. Popular fundamental indicators include the price to earnings (P/E) ratio and the dividend yield. Popular technical indicators include moving averages and the relative strength index or RSI. Less popular are economic indicators.

When investors do consider economic indicators, they often look at the so called headline numbers. This might include the unemployment rate or an inflation report. Even less well known are obscure indicators like the ECRI Weekly Leading Index.

ECRI is the Economic Cycle Research Institute, an organization with a long history. As ECRI explains,

“A century-long tradition of business cycle research gives ECRI a singular perspective on the ebb and flow of the economy, even in the face of unexpected shocks. Our approach is informed by the fundamental drivers of economic cycles.

It is an approach pioneered by ECRI’s co-founder, Geoffrey H. Moore, and his mentors, Wesley C. Mitchell and Arthur F. Burns.

In 1950, Moore built on his mentors’ findings to develop the first leading indicators of both revival and recession. In the 1960s he developed the original index of leading economic indicators (LEI). It is a testament to the quality of that breakthrough that, nearly half a century later, many still believe the LEI and its variants to be the best tools for cycle forecasting.

However, building on that foundation, by the late 1990s ECRI had put together a far more sophisticated framework for analyzing international economic cycles that remains at the cutting edge of business cycle research and forecasting.”

The ECRI Leading Index is shown in the chart below.

ECRI Leading Index

Source: BusinessCycle.com

This index has a moderate lead over cyclical turns in U.S. economic activity. Historical data begins in 1967. The indicator is designed to predict the timing of future changes in the economy’s direction.

The Leading index is intended to “signal those turns before the fact, and well before the consensus. ECRI’s focus is on identifying when those changes in direction will occur.” An explanation of a leading index is shown next.

leading indexes chart

Source: BusinessCycle.com

To help assess where we are in the cycle, it is common to consider the year over year change in economic data. That change is shown in the next chart.

weekly leading index chart

Source: BusinessCycle.com

The year over year change is now below zero, an ominous signal for the economy.

ECRI has warned that the economy could be approaching a recession.

The problem is … the cyclical drivers of economic growth continue to wind down, meaning that the slowdown is set to continue. That’s the objective message from the same array of leading indexes that we used to predict the current U.S. economic slowdown in the context of a global slowdown last year.

A case in point is the publicly available U.S. Weekly Leading Index, whose growth rate remains in a cyclical downswing.

If the U.S. slowdown continues until the opening of a recessionary window of vulnerability, within which almost any negative shock would trigger recession, it will be too late for the Fed to head off a hard landing, as it was before the 2001 and 2007-09 recessions.

Today, despite the risk-on rally, a couple of conflicting concerns linger – fears of recession down the road and residual worries about resurgent inflation. To be sure, a recession isn’t imminent, but it’s not off the table. At the same time, a renewed upswing in inflation is nowhere in sight.”

Does It Work?

ECRI is an independent research group and their work is highly respected. They have back tested their indexes and have an impressive track record. One example shows how their research worked in the past, correctly identify the turning points in the early 1990s.

U.S. leading services index

Source: BusinessCycle.com

More recent forecasts include a warning in October 2018 that ““The global industrial slowdown we first forecast a year ago is in full swing and set to worsen. Meanwhile, with purchasing managers indexes actually lagging last November’s peak in global industrial production growth, the consensus was caught behind the curve.”

Investors who heeded that caution could have decreased their exposure to the stock market and avoided some of the decline that marked the fourth quarter last year.

Current Outlook

ECRI recently noted,

“Today, our research shows that the U.S. economy is approaching a recessionary window of vulnerability. But it isn’t yet in that window, so the economy remains relatively resilient to shocks. Therefore, while our lonely forecast last year of a cyclical slowdown in growth has now proven correct, it’s premature to conclude that a recession is imminent.

Our track record isn’t perfect, but we have been consistent in making some of the most impactful predictions in recent history. We made a timely U.S. recession call well ahead of the Lehman Brothers collapse. We were then virtually alone early the next spring in correctly predicting the end of the Great Recession in real time.”

Investors can follow ECRI’s indexes or turn their attention to important economic indicators. Economist tend to watch four indicators for signs of recessions:

  • Nonfarm Employment
  • Industrial Production
  • Real Retail Sales
  • Real Personal Income (excluding Transfer Receipts)

The recent readings of these indicators is shown in the next chart:

Big Four Indicators

Source: AdvisorPerspectives.com

Analysts noted, “The US economy has been slow in recovering from the Great Recession, and the overall picture has been a mixed bag. Employment and Income have been relatively strong. Real Retail Sales have been rising but below trend. Industrial Production has been slow to recover and has finally been showing signs of improvement.”

This data has been delayed by the government shutdown. Some economists question the data as it is released believing that there could be problems with data gathering associated with the shutdown and are waiting for revisions.

But, for now, the big four are supportive of an economic expansion even if the picture is weakening. As ECRO notes, a recession isn’t imminent, but it’s not off the table. That means investors should be attentive to economic indicators, even if it is not popular to do so.

Watching for signs of additional weakness could help investors avoid a sharp downturn in the stock market that often accompanies recessions.


Did you know that dividends have rewarded investors for at least 100 years, at least since John D. Rockefeller said, “Do you know the only thing that gives me pleasure? It’s to see my dividends coming in.”

We have prepared a special report about dividends that you can access right here.
Economy

Business Execs Are Increasingly Worried About Recession

Every quarter, executives of large companies share their outlook with analysts in conference calls after earnings are announced. In these calls, management often discusses items that are of concern. According to FactSet, the strong dollar is among the primary concerns of many companies.

S&P 500 chart

Source: FactSet

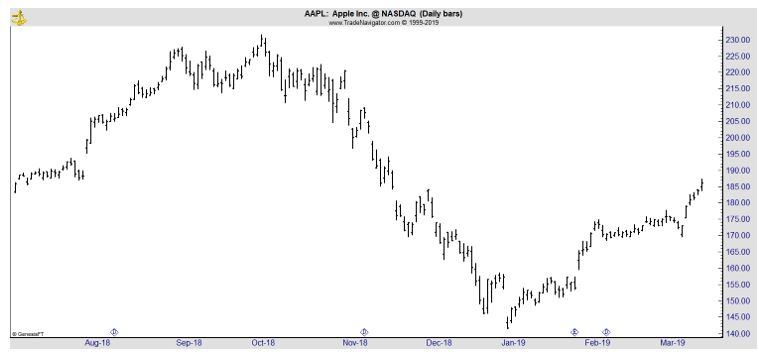
Specific markets can also be a concern, as Apple noted, “In fact, most of our revenue shortfall to our guidance, and over 100 percent of our year-over-year worldwide revenue decline, occurred in Greater China across iPhone, Mac and iPad. China’s economy began to slow in the second half of 2018.

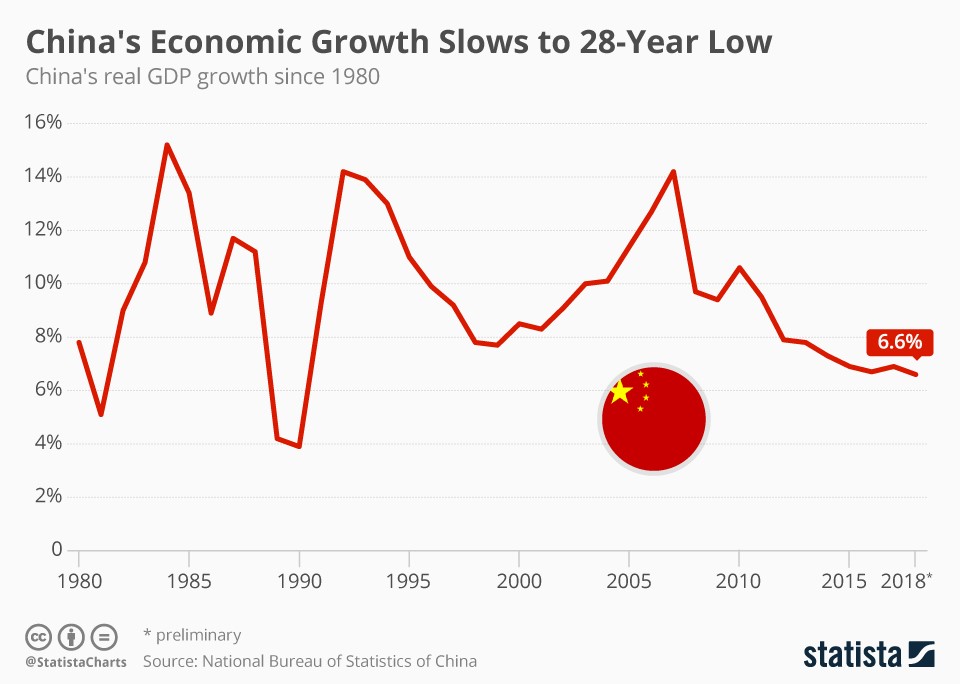
The government-reported GDP growth during the September quarter was the second lowest in the last 25 years. We believe the economic environment in China has been further impacted by rising trade tensions with the United States.”

These concerns sent shares of Apple lower in January.

AAPL daily chart

Rising Fears of an Economic Slowdown

Analyzing these calls can offer valuable insights to investors. That’s especially true when common themes emerge from the calls and that appears to be happening according to analysts at Gartner,

“Analysis of S&P 500 2018 earnings transcripts shows fading exuberance among corporate executives as the year progressed, according to Gartner, Inc. Several sectors are undergoing an earnings recession, and efficiency and restructuring initiatives are increasingly common.

“S&P 500 company executives are concerned about the risks and uncertainty from government interventions rather than suspecting any global macroeconomic downturn in the near term,” said Tim Raiswell, vice president at Gartner’s finance practice. “Talk of capital and cost-efficiency programs was increasingly common in earnings calls as 2018 progressed.”

“Mentions of the words ‘downturn’ and ‘slowdown’ were four times more likely to appear in earnings call in 4Q18,” said Mr. Raiswell. “Yet it’s important to consider that 4Q18 brought relatively extreme drops in stock prices. After 10 years of economic expansion, it’s not surprising to see analysts asking company executives about their preparations for cyclical economic weakness.”

Most executives, however, remained optimistic about the U.S. economy in 2019. The companies most exposed to China were more likely to report demand weakness in 2018, or predict it occurring in 2019. Sentiment was particularly positive in the technology and communications sectors.

“Even while expressing a broadly positive economic outlook, many of the world’s largest companies are starting to behave as if they are in a recession,” said Mr. Raiswell. “Ford, Pepsi and P&G are all recent high-profile examples of companies announcing large-scale efficiency programs.”

The most commonly cited economic concern was the slowing Chinese economy.

China's economic growth slows

Source: Statista

This theme emerged strongly in 4Q18 and has since picked up momentum in 2019 earnings calls. Much of this concern for China and the wider global economy outside the U.S. was more related to unpredictable government interventions than to any strong conviction of underlying economic weakness.

Common U.S.-related concerns were the recent government shutdown, tariffs and trade policy uncertainty. Worldwide political issues cited were Brexit and the fractious political landscape within the Eurozone, as well as concerns in the Middle East and in South America.

“Given the lack of realistic precedents in many cases, all parties are largely guessing about the extent to which political rhetoric will become firm policy and what the impact will be on companies’ order books,” said Mr. Raiswell.

“In this uncertain environment and after a long stretch of expansion since 2009, a significant number of leading firms are taking a recessionary stance and making preparations to capitalize on a downturn rather than be a casualty of one.”

The growth of nonbank lending emerged clearly in financial services earnings calls. Nonbanks offer high-risk loans to consumers at prices that many banks are not willing to match. This strong competition is why the theme emerged in earnings conversations.

“While many economists suspect that the next U.S. recession will take a different form than the financial liquidity crisis of 2009, there should be concerns among CFOs and treasurers that this growth of nonbank lending poses a risk to the U.S. financial system. Nonbank portfolios tend to be built on higher-risk loans to low-income clients. A combination of this phenomenon and any future easing of banking and lending regulations could spell trouble for the global economy in the next few years,” said Raiswell.

Other Trends

Many large firms reported that cost management initiatives are well underway, largely targeting overhead categories such as marketing, advertising and finance, as well as direct industrial production costs.

For example, P&G, Estée Lauder, Whirlpool and others all detailed significant firmwide productivity programs. Several vehicle manufacturers, such as Honda, Ford and Nissan, began initiatives to consolidate their production in fewer facilities to drive efficiencies. Many more firms reported deliberately lower capital expenditure than expected in 2018, as growth capital was reallocated.

“The CFO’s posture is critical now. Gartner cautions against a ‘business as usual’ approach that fails to change a winning formula when faced with turns in market direction,” said Mr. Raiswell.

“While signs of early preparation bode well for company performance, if a downturn appears, this preemptive behavior does raise questions. How much further will executive teams have to cut costs if demand plummets, and will this take the form of more-drastic forms of restructuring, such as layoffs and divestitures?”

Other analsyst saw similar themes. CNBC reported, “As this earnings season starts wrapping up, a common theme emerged from hundreds of conference calls: Managers had difficulty providing concrete guidance for 2019 earnings due to the uncertainty around trade, according to David Kostin, chief U.S. equity strategist at Goldman Sachs.

“Several management teams assumed that the March 1 tariff rate increase would occur. However, some firms remained optimistic about the prospects for a deal in 2019. Additionally, firms are seeing the impact of increased uncertainty in customer decision making,” Kostin said in a note.

The tone of the calls appears to have been generally concerned. There is less cause for alarm when management is muted but there is cause for concern since the calls were low on optimism. Uncertainty about trade, efforts to reduce costs and fears of recession could weigh on earnings.

These factors could also weigh on stock prices and with stock prices extended, now could be a time for investors to exercise caution as the executives of major companies are.


Did you know that dividends have rewarded investors for at least 100 years, at least since John D. Rockefeller said, “Do you know the only thing that gives me pleasure? It’s to see my dividends coming in.”

We have prepared a special report about dividends that you can access right here.
Economy

This Could Be the Time to Buy a Home

If you are renting and considering buying a home, now could be the time to make the move based on recent data. If you’re looking at adding an investment property to your portfolio, this same data could also support that decision.

The news, according to CNBC is that the median monthly rent in February rose to $1,472, an increase of 2.4 percent compared with February 2018, according to Zillow. For the typical renter, this means about $400 more per year.

The news site noted, “Home prices may be cooling off right now, but rents are heating up yet again.”

After taking a breather in 2018, due to new supply on the market, rents for both single-family homes and multifamily apartments are now rising at the fastest pace in nearly a year, according to Zillow.

“The rental market spent part of last year catching its breath after several years of breakneck growth,” said Zillow economist Jeff Tucker.

“Landlords are now coming to terms with the fact that rent cannot grow faster than income forever, and after that short correction we can expect a much more vanilla, slow-growth market going forward. As we enter the 2020s, the demand for rentals is projected to fall as many millennials move on to homeownership.”

Rents slowed for much of last year because of robust construction in the apartment market. Much of the new supply was on the high end, and some were concerned that vacancies would rise. Demand, however, remained strong, and now the supply is leveling off.

“Consistently, apartment occupancy growth has nearly kept pace with supply growth, as demand for apartments has been robust throughout 2018,” noted Barbara Denham, senior economist at Reis, in a December report.

“Not only has job growth supported apartment demand, but the weaker housing market has also benefitted the apartment market.”

Home sales have yet to rebound so far this year, and home prices are still gaining. Mortgage rates, however, dropped at the end of last year and continue to fall this month, signaling potential strength in the spring market.

More robust sales could take a little heat out of the rental market, but there is still a very low supply of entry-level homes for sale, meaning some potential first-time buyers will continue to rent, whether they want to or not.

Local Prices Vary

Of course, all real estate is local, with rents now significantly higher than a year ago in:

  • Orlando, Florida (+7.0 percent),
  • Phoenix (+6.8 percent),
  • Riverside, California (+6.2 percent),
  • Tampa, Florida (+5.5 percent) and
  • Pittsburgh (+4.9 percent).

According to Zillow, “the priciest major metro in the country remains San Jose, Calif., at $3,547 in February, up 1.4 percent from a year earlier.

It’s followed by San Francisco at $3,448 a month (up 1.6 percent), Los Angeles at $2,835 a month (up 3.5 percent), San Diego at $2,643 a month (up 4.2 percent) and New York at $2,419 (up 1.2 percent).

The lowest rent prices among major metros in February were Pittsburgh at $1,100 a month (up 4.9 percent), St. Louis at $1,155 a month (up 1.6 percent), Cleveland at $1,162 a month (up 1.7 percent), Detroit at $1,225 a month (up 2.3 percent) and Indianapolis at $1,234 a month (up 2.7 percent).”

Nationally, the trend could be worrying for renters.

national trend

Source: Zillow

The recent increases have pushed rental prices to a level that makes rent almost unaffordable for many.

Zillow rent and mortgage affordability

Source: Zillow

This could mean rates of increases will slow in the future and be in line with changes in wages. As the chart shows, the average share of income spent on rent, 28.2%, is well above its historic average of about 26%.

Wage growth is about 3.4% according to data provided by the Atlanta branch of the Federal Reserve. This could indicate that the average share of income spent on rent could remain relatively elevated as wages increase gradually.

Owners May See Slower Gains

MarketWatch cited reason for caution in the real estate market, “Meanwhile, home value appreciation dropped to its lowest rate since December 2017. The median U.S. home value, as measured by Zillow, was $226,300 in February, up 7.2% from the previous year.

The cool down in home values was most notable in San Jose, Calif., and San Francisco. That’s down from a 7.8% annual rate of home value appreciation in January.

One major reason why home values aren’t rising as fast any more is that the inventory of homes for sale increased 1% year-over-year last month, making it the fifth out of the last six months in which inventory increased.”

The trend in prices is shown in the next chart.

Zillow home value index

Source:  Zillow

As this chart shows, prices are at new all time highs and the pace of recent gains has been high, but rather steady and not indicative of a bubble as we saw in many markets in the early 2000s. One reason for that could be slower construction activity which is in contrast to the rapid pace of building in the bubble.

Analysts note that zoning restrictions and costs of construction could serve to limit new homes for some time. Limited supply could support higher home prices, even if the appreciation in prices falls to levels that are closer to their long term average which is in line with the rate of inflation.

The outlook is for slower gains, “U.S. home values are growing at a steady pace, and have surpassed pre-recession highs nationally and in a number of large markets. Driven largely by limited inventory and high demand, home values are growing fastest at the bottom end of the market.

Regionally, markets in the Pacific Northwest, Texas, Florida and parts of the Southwest continue to outperform slower-moving markets in the Midwest and Mid-Atlantic.”

Given the trend in prices, now could be an ideal time to consider a home, while rates are low, and prices are on the rise. This could benefit owners who reside in the home who could benefit from appreciation or owners who rent and could benefit from slightly higher rents in the next few years.


Did you know that dividends have rewarded investors for at least 100 years, at least since John D. Rockefeller said, “Do you know the only thing that gives me pleasure? It’s to see my dividends coming in.”

We have prepared a special report about dividends that you can access right here.

Stock market

Big Investors Are Doing Something Small Investors Should Consider

On Wall Street, many analysts talk about the smart money. This represents the large funds and investors with millions of dollars. They are called smart money not necessarily because they are all highly intelligent. They are smart money because when they act together, they move markets.

There’s nothing mysterious about smart money. Large investors move significant amounts of money. They tend to read similar research and notice similar trends in the market. Some will lead and others will follow but they tend to move as a herd.

While some analysts focus on the underlying causes of market moves, others believe that the cause is less important than the trend so they simply follow the smart money.

Treasuries Offer a Safe Haven

According to The Wall Street Journal, many large investors are buying Treasuries. The news service noted,

“Investors are buying more newly issued U.S. government bonds at auctions, underscoring how signs of decelerating economic growth and the Federal Reserve’s caution toward further interest-rate increases have boosted demand for Treasurys.

Domestic investors purchased a record of roughly 55% of the new U.S. government notes and bonds sold at auction in January. That is up from 51% a year ago.

percentage of Treasury note and bond auctions

Source: The Wall Street Journal

Investors are also winning a greater share of auctioned bonds—more than 90% through February, up from 82% in the year-earlier period. That suggests mutual funds are willing to bid at higher prices than before to ensure that they get the bonds they want.

percentage of winning auction treasury bids

Source: The Wall Street Journal

“The Fed’s going to be on an extended pause,” said Michael Kushma, chief investment officer for fixed-income with Morgan Stanley Investment Management. “The hurdle for resuming rate hikes is pretty high.”

Investors are now betting that an interest-rate reduction is more likely by the end of the year. That comes after last week’s jobs report missed estimates by a wide margin and the European Central Bank dashed any plans to raise rates this year. Investors will get a fresh look at the situation this week as the Commerce Department reports on retail sales data Monday and the Treasury auctions $78 billion of notes and bonds.

This year’s Treasurys demand surprised some analysts after expectations for a pickup in growth and inflation around the world helped drive yields to multiyear highs in November. Yields rise as bond prices fall.

Many had said the rising size of Treasury auctions, lifted by the government’s tax cuts and spending increases, was one factor behind the climb in yields last year.”

The report continued,

” Much of the demand has stemmed from investors’ increasing appetite for longer-term debt, which tends to lose its value more quickly when interest-rates are rising, said Jim Vogel, head of interest-rate strategy at FTN Financial.

While the amount of auction bids submitted by investors has remained stable, their higher winning percentage suggests they are bidding at higher prices, he said.

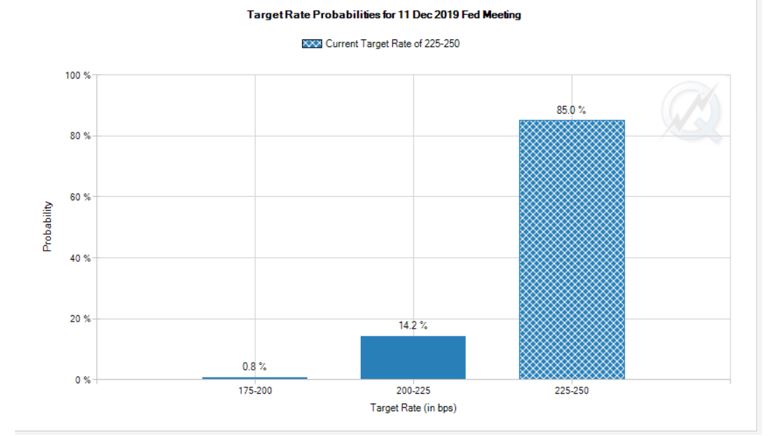
Few are betting that policy makers will lift rates again soon. Fed-funds futures, which investors use to bet on the direction of central bank policy, recently showed an 80% probability that the Fed holds rates steady this year, with 20% odds that rates will fall and no chance they will end the year higher, according to CME data late Thursday. The odds of a rate increase have fallen from 23% a month ago.”

Updated probabilities are shown in the next chart.

Target Rate probabilities

Source: CME

While weaker job growth may prevent the Fed from raising rates, higher labor costs could prevent it from lowering them.

“Investor expectations are usually anchored by the central bank’s expectations,” said Thanos Bardas, a global co-head of investment grade bond investments at Neuberger Berman.”

If You Can’t Beat Them, Join Them

Individual investors can follow the smart money into Treasuries. Treasury notes could be bought for as little as $100. And the purchases can be made at no cost.

Treasuries can always be bought, for free, through the Treasury’s web site, TreasuryDirect.gov. Individuals obtain the interest rate available to large investors by submitting noncompetitive bids for bills, notes or bonds through that site. There is no fee so returns are generally going to beat those available through passive money market funds or exchange traded funds (ETFs).

Investors could consider Treasury notes, like other marketable Treasury securities, are debt obligations of the U.S. Government and are backed by the government’s full faith and credit. Offered in multiples of $100, notes pay interest every six months at a rate determined when they are auctioned.

Notes can be held to maturity or sold prior to maturity. At maturity, the principal is paid to the owner.

Treasury currently issues notes as follows:

Treasury Notes

Source: TreasuryDirect.gov

Notes can be purchased either directly from Treasury or through an intermediary such as a bank or broker. Interest from notes is exempt from state and local income taxes, but subject to federal tax.

Notes may strike the balance between risk and reward. Buying bonds, securities that mature in more than 10 years and potentially as long as 30 years, are subject to greater interest rate risk. That means when interest rates rise, the bonds will lose part of their value.

Even if an investor holds a 30 year bond until maturity and receives back 100% of the principal invested in the bond, there could still be a loss of purchasing power due to inflation. While it is possible that inflation will stay low for 30 years, many investors will be more comfortable with less risk than that.

Treasury notes, or bonds for more risk tolerant investors and bills for less risk tolerant investors, could be an ideal position to add to increase diversification. They can even be added to a portfolio for free although they often trade at little cost at discount brokers.

If there is a flight to safety, the investment could increase in value, at which time it could be sold if held in a brokerage account. TreasuryDirect could be best for investors committed to owning securities through maturity.


Did you know that dividends have rewarded investors for at least 100 years, at least since John D. Rockefeller said, “Do you know the only thing that gives me pleasure? It’s to see my dividends coming in.”

We have prepared a special report about dividends that you can access right here.

Cryptocurrencies

Are Cryptos a Recession Hedge?

Recession is a word that chills investors. With good reason. The stock market often declines before the economy contracts and the declines in recessions tend to be significantly steeper than stock market sell offs that occur while the economy is expanding.

That makes recent research from the Fidelity Asset Allocation Research Team, which advises Fidelity’s fund managers, especially disturbing.

The team studies the business cycle, because they believe it helps determine the direction of stocks. In a recent report, it said the U.S. entered the late stage of the business cycle late last year.

business cycle chart

Source: Barron’s

Barron’s summarized the research, noting, “Developed economies like Germany, France and Italy are much deeper into the late stage of the business cycle, as are Canada, South Korea and Australia. Emerging markets like Brazil, Mexico and India also just entered the late phase.

The U.K., reeling from pre-Brexit chaos, is on the cusp of recession. China, the researchers say, is already there, although they define it as a “growth recession” because the Chinese economy has marked slowdowns, not actually negative growth.”

This matters to investors because, although bear markets are only fair predictors of recessions (seven of 13 postwar bear markets were followed by economic downturns), bear markets that precede recessions tend to be longer and deeper, averaging declines of 37%.

So if the economy is indeed in the final phase of its long recovery, that’s a warning sign to investors to get more defensive.

“We’ve just been through the best parts of the cycle for risky assets,” Dirk Hofschire, Fidelity’s senior vice president of asset allocation research, told me in a phone interview.

“Late cycle is sort of the transition phase. By the end of the cycle, when we move into recession, that’s when you would want to be a little more risk-off.”

Could Cryptos Rise in a Recession?

Cryptocurrencies haven’t really seen a recession. Barron’s reported, “This new, decentralized asset class was born at the tail end of the housing crisis, and has yet to experience the full force of a recession or even lengthy bear market.

For years, digital assets have existed in a period of market expansion in the United States. Gross Domestic Product (GDP) has increased significantly, bringing total average GDP growth from -1.73% in 2009 to 3.138% in 2017; and unemployment has dropped from 10% to 4%, with more than two million jobs created each year for the past eight years.

Unfortunately, what’s been a positive sign for upward trends in traditional markets has had an adverse impact on the mainstream appeal of digital assets.

Because the economy has steadily improved throughout the industry’s life-span, some more casual observers have failed to fully appreciate how the intrinsic qualities of blockchain-based assets (e.g., decentralization, immutability, and bespoke structures) may benefit them.

As a result, many have erroneously assumed all digital assets are functionally interchangeable, and will all react the same way to economic fluctuations.

As is the case with any industry, companies weathering the impact of a severe market correction are, understandably, going to react differently based on their business models, leverage, and market capitalization.

That’s not to say we’ll know exactly what will happen during a recession—it’s perfectly plausible, if not likely, that there will be at least some material degree of performance correlation between various digital assets.

However, what’s more likely is that we’ll begin to see certain digital assets, each equipped with their own unique value proposition, begin to separate themselves from the pack and gain momentum as a result of their inherent structural value, not merely from speculation or the rising tide of a bullish crypto market.

Faced with a recession, Bitcoin may serve a market function similar to that of a safe-haven commodity, rather than an equity, due to its inherent scarcity and decentrality. Bitcoin, by design, is not intended to be used as a foundation on which developers could build a platform or enterprise.

Because its supply is not controlled by any one person or entity, it’s more likely that Bitcoin will perform independently of broad market pressures (akin to how one would expect gold to react)—potentially even appreciating in value should demand for alternative forms of dependable value storage arise.”

Bitcoin daily chart

By contrast, Ethereum is far more likely to follow market trends. That’s because its platform allows other companies to build products on top of the Ethereum protocol, putting significant onus on mainstream investors to keep products afloat.

If the investors suffer, the companies suffer, which causes Ethereum to suffer as a result. Because Ethereum is a developer-focused blockchain, it’s very much dependent on how many companies use the Ethereum platform to build their projects.

If those companies were to go out of business, Ethereum’s relevance and, subsequently, its price, would undoubtedly be affected. That’s not to say Ethereum is structured similarly to equity markets by any means, but it’s more closely entangled with equity markets than most other digital assets.

Ethereum chart

Ripple’s XRP is a payments-focused digital asset that currently has the third largest capitalization in the crypto industry. Unlike Bitcoin and Ethereum, Ripple digital currency is frequently used for frictionless financial asset transfers, functioning more as a medium of exchange than other digital assets.

Because XRP functions outside the purview of mainstream markets, it’s certainly reasonable to believe that XRP would act independently in the event of a recession. On the other hand, however, XRP’s price is also highly dependent on issuance and adoption.

If Ripple loses usership—either because its issuance was mismanaged or because other projects (such as J.P. Morgan ’s new coin JPM) became more popular—XRP’s value would almost surely go with it.

Ripple daily chart

This all indicates that cryptos could be worth considering. Even if the economy grows, the assets could be bargains after their extended bear market. If the recession does strike, cryptos could bounce as investors seek safe havens. That could deliver significant gains to traders in the asset class.

The bottom line is that cryptos are worth considering for both long term investors and short term traders.


Did you know that dividends have rewarded investors for at least 100 years, at least since John D. Rockefeller said, “Do you know the only thing that gives me pleasure? It’s to see my dividends coming in.”

We have prepared a special report about dividends that you can access right here.

Stock market strategies

If You Follow Buffett, You Might Have This Problem In Your Portfolio

Warren Buffett is widely followed because he has delivered a long record of successful investments. Not all of Buffett’s investments work but he often exits a position before there is a large loss. Of course, Buffett is not perfect, and he does occasionally suffer through large losses.

One example is Wells Fargo & Company (NYSE: WFC). The bank lost more than 80% of its value in the bear market that began in 2008 and then lost more than 20% of its value after reports that the bank was creating fake accounts for customers.

WFC monthly chart

In the long run, Buffett does appear to have done fine with WFC. But that is an opinion based on hindsight. A more challenging question could be what to do if your stock suffers a steep sell off? Buffett is forced to address that question based on his investments in Kraft Heinz stock (Nasdaq: KHC).

Confronting Bad News

KHC has sold off sharply in recent weeks.

KHC weekly chart

Barron’s summarized the problems that have pushed the stock price lower, noting that the company “isn’t catching any breaks—Bernstein has joined the numerous analysts who have downgraded the shares.

… Kraft hasn’t been having a great year to begin with. The stock tumbled more than 8% after its previous earnings report in November fell short of expectations. Kraft’s bottom-line results not only missed, but the results showed it had sacrificed pricing for growth, and investors reacted negatively.

The quarter showed that what used to be considered safe stocks just aren’t so safe anymore.

[More recently], it became clear that Kraft’s problems ran deeper than the staples slump.

 Not only did its fourth quarter and guidance disappoint, but the company also cut its dividend, took a $15.4 billion asset write-down related to its Kraft and Oscar Mayer brands, and disclosed that the Securities and Exchange Commission has been investigating its procurement division’s accounting practices since October 2018.

…Not surprisingly, Kraft’s trouble led to steep stock declines and plenty of analyst downgrades for the shares. … Bernstein’s Alexia Howard added her voice to the chorus of caution, downgrading the stock to Market Perform and cutting $11 from her price target, to $50.

She wrote that her bull thesis was undercut by high cost pressures in the fourth quarter, a problem Kraft warns will persist this year.

Howard was disappointed not only with the downbeat earnings and guidance, along with other problems, but worries that issues don’t bode well for Kraft’s ability to raise prices later this quarter—something investors clearly want to see.

She also warns there is a lack of catalysts that can boost the stock’s valuation, despite how far it has fallen. (Likewise, Warren Buffett, who owns Kraft, said he doesn’t think the shares look particularly cheap despite their plunge.)

…Howard writes that “the company’s visibility into future financial performance is limited,” and without some bottom-line improvement, Kraft’s multiple will have little fuel to expand. Perhaps an even bigger issue: “It will take quite some time for management to rebuild credibility with investors.”

That seems to be an understatement.

It isn’t that Kraft doesn’t have a valuable portfolio of brands—after all Heinz ketchup is so dominant it has spawned listicles testifying to its irreplaceable taste.

But consumer brands are being squeezed—both by changing tastes that favor fresh, organic alternatives to shelf-stable packaged goods and by shoppers choosing lower margin-store brand alternatives.

Kraft may have the quality products to weather the storm, but management hasn’t done much to demonstrate it has the ability to navigate the new normal.”

Possible Actions for Investors

“We know that Buffett’s purchases are widely copied, which means many people own Kraft Heinz,” according a recent Barron’s story. The news site also offered some insights on what to do next.

“An investor fearing such a selloff, or someone who wants to earn some money from a dead-money stock, should consider selling upside call options against stock to shrink the unrealized loss. The strategy, known as “overwriting,” is a classic stock-management tool.

On any given day, fund managers overwrite positions with calls that have strike prices that reflect their stock-target prices. If they think a stock is fully valued at $45, they sell $45 calls at various expirations and pay themselves to wait.

With Kraft Heinz at $32.71, investors can sell the January $37.50 call for $2. If the stock remains below $37.50, investors keep the premium. Should the stock be at the strike price at expiration, investors must sell the stock at $37.50 or cover the call.

The risk to overwriting is that investors miss any rallies above $37.50. Kraft Heinz stock has ranged from $32.05 to $68.59 over the past 52 weeks.

The overwrite can be enhanced with a short put to create a “short strangle,” or “combo.” This is for investors who want to buy Kraft Heinz, but at a lower price. The January $30 put was recently bid around $2.40.

Selling puts on damaged stocks that are hard to evaluate is like dancing on the roof. If the roof gives way, you’re in trouble—or stuck, in this case, having to buy the stock at $30, even if it is trading at $20. Or you could pay top dollar to cover the put.

It can be difficult to repair damaged stocks, especially after a company’s management has violated investors’ trust.

Many investors say it is better to realize losses than wait for a recovery. But maintaining a sell discipline can be difficult. Besides, many investors likely own Kraft Heinz at sharply lower prices, due to historical spinoffs, and they likely reason that they can wait for the stock to recover.

We have no idea if Buffett is using options to manage his Kraft Heinz position, although he is no stranger to the options market. He has used options in the past to control stocks around corporate mergers.

He also sells options that expire in more than 10 years on major stock indexes, often committing billions of dollars in an over-the-counter market that insurance companies use to hedge the guaranteed returns of variable annuity contracts.

Our approach is less majestic. It simply expresses a view that a little life can be breathed into wounded stocks, one trading breath at a time, in the options market.”

Even if you don’t own Kraft, these strategies could be useful the next time one of your stocks drops sharply, an event that is possible even for the greatest investors.


Did you know that dividends have rewarded investors for at least 100 years, at least since John D. Rockefeller said, “Do you know the only thing that gives me pleasure? It’s to see my dividends coming in.”

We have prepared a special report about dividends that you can access right here.

Retirement investing

New Thinking on Reverse Mortgages

A reverse mortgage, according to Investopedia, “is a loan. A homeowner who is 62 or older and has considerable home equity can borrow against the value of their home and receive funds as a lump sum, fixed monthly payment or line of credit.

Unlike a forward mortgage – the type used to buy a home – a reverse mortgage doesn’t require the homeowner to make any loan payments.

Instead, the entire loan balance becomes due and payable when the borrower dies, moves away permanently or sells the home.

reverse mortgage definition

Source: National Center for Home Equity Conversion

Federal regulations require lenders to structure the transaction so the loan amount doesn’t exceed the home’s value and the borrower or borrower’s estate won’t be held responsible for paying the difference if the loan balance does become larger than the home’s value.

One way this could happen is through a drop in the home’s market value; another is if the borrower lives a long time.

Reverse mortgages can provide much-needed cash for seniors whose net worth is mostly tied up in the value of their home. On the other hand, these loans can be costly and complex – as well as subject to scams.

Potential Pitfalls

These products are looked on with skepticism by many. And with good reason in some cases.

The FBI and the U.S. Department of Housing and Urban Development Office of Inspector General (HUD-OIG) urge consumers, especially senior citizens, to be vigilant when seeking reverse mortgage products.

FBI logo

Reverse mortgages, also known as home equity conversion mortgages (HECM), have increased more than 1,300 percent between 1999 and 2008, creating significant opportunities for fraud perpetrators.

Reverse mortgage scams are engineered by unscrupulous professionals in a multitude of real estate, financial services, and related companies to steal the equity from the property of unsuspecting senior citizens or to use these seniors to unwittingly aid the fraudsters in stealing equity from a flipped property.

In many of the reported scams, victim seniors are offered free homes, investment opportunities, and foreclosure or refinance assistance. They are also used as straw buyers in property flipping scams. Seniors are frequently targeted through local churches and investment seminars, as well as television, radio, billboard, and mailer advertisements.

A legitimate HECM loan product is insured by the Federal Housing Authority. It enables eligible homeowners to access the equity in their homes by providing funds without incurring a monthly payment.

Eligible borrowers must be 62 years or older who occupy their property as their primary residence and who own their property or have a small mortgage balance. See the FBI/HUD Intelligence Bulletin for specific details on HECMs as well as other foreclosure rescue and investment schemes.

The FBI also provides for avoiding scams:

  • Do not respond to unsolicited advertisements.
  • Be suspicious of anyone claiming that you can own a home with no down payment.
  • Do not sign anything that you do not fully understand.
  • Do not accept payment from individuals for a home you did not purchase.
  • Seek out your own reverse mortgage counselor.

New Thinking

Barron’s recently noted, “Reverse mortgages were once anathema to savvy financial planning. These loans—which let homeowners over age 62 pull equity out of their homes while still living in them—were viewed as a costly last resort for covering retirement shortfalls.

That thinking has changed as older owners find themselves sitting on record levels of home equity, while at the same time grappling with how to maximize retirement income. Though the upfront costs of reverse mortgages can be steep—we’ll get to that in a minute—when used judiciously, they can be a valuable tool in retirement.

“One of the most intriguing benefits, I think, is spending coordination with your portfolio,” says Neil Krishnaswamy, a financial planner and enrolled agent with Exencial Wealth Advisors in Frisco, Texas.

Borrowers can effectively use a reverse mortgage as a line of credit that they access when needed: They only pay interest on what they use, and the proceeds aren’t taxed.

In the event of a major market decline, for example, borrowers can access this equity in lieu of tapping their portfolios in a down market. “One of the biggest risks in retirement is that markets may not cooperate,” Krishnaswamy says. “If you have the option to access cash for spending in a tax-efficient manner, you can mitigate some of that risk.”

Some other uses: Homeowners who still have mortgages can use the proceeds of a reverse mortgage to pay off those loans and improve their cash flow, Krishnaswamy says. Depending on your age and health, a reverse mortgage may also be a less expensive insurance policy against long-term healthcare needs—and it might be the difference between claiming Social Security early or holding off for a higher payout.

The catch, of course, is that you or your heirs will need to pay back the loan when you sell the house or when you and your spouse both pass away. Interest, which recently hovered around 5%, accrues on any equity you access. Then there are the fees, which, although though rolled into the balance of the reverse mortgage, can be the biggest sticking point.”

Origination fees are the most significant up-front costs. Under HECM, a lender can charge up to 2% of the first $200,000 of the home’s value or $2,500, whichever is greater, plus 1% of any amount above $200,000. HECM caps total origination fees at $6,000.

Borrowers also need to pay FHA mortgage insurance premiums equal to 2% of the maximum claim amount, plus 0.5% of the outstanding balance annually. In the event a lender cannot pay out the reverse mortgage proceeds, insurance kicks in. If the value of the property falls below the outstanding loan balance, borrowers or their heirs don’t need to make up the difference.

In addition to these big fees, reverse mortgage borrowers also pay monthly servicing fees, which are capped at $35, plus many of the same upfront costs associated with getting a traditional mortgage. Those include appraisal fees, credit report fees, escrow fees, document preparation, and more.

All told, for loans of up to $200,000, for instance, a borrower could pay as much as $10,000 in upfront fees—which are typically rolled into the loan balance—plus ongoing mortgage insurance premiums and service fees of about $1,400 a year.

There are benefits and drawbacks just as there are with any investment.

Barron’s quoted one expert who said, “I’ve come full circle on reverse mortgages,” says Steve Vernon, a consulting research scholar at the Stanford Center on Longevity, and author of “Retirement Game-Changers.”

He added that he has even recommended it as an option for his friends in the San Francisco Bay Area, where average single-family home prices sit just under $1 million. “The costs of the loans are high,” he says, “but if you love your house and don’t have other resources, it’s something to consider.”


Did you know that dividends have rewarded investors for at least 100 years, at least since John D. Rockefeller said, “Do you know the only thing that gives me pleasure? It’s to see my dividends coming in.”

We have prepared a special report about dividends that you can access right here.

Stock market strategies

This Could Be the Perfect Trade to Prepare for the Market Correction

In case any investor forgot, prices go both up or down. This was a lesson brought home to investors in the fourth quarter of 2018.

S&P 500 index

In the fourth quarter, the S&P 500 (shown above) fell slightly more than 20% from high to low. In the first weeks of 2019, the index rallied almost 20%.

Of course, that’s history and the question now could be what comes next.

Overvaluation Could Lead to a Decline

Investors might want to believe the decline has ended but it’s important to remember that many market declines begin when stocks are overvalued. The next chart shows the current state of the market using a popular valuation tool.

Shiller PE Ratio

Source: cmgwealth.com

This is the Shiller PE ratio which is defined by Investopedia as “a valuation measure, generally applied to broad equity indices, that uses real per-share earnings over a 10-year period.

The P/E 10 ratio uses smoothed real earnings to eliminate the fluctuations in net income caused by variations in profit margins over a typical business cycle. The P/E 10 ratio is also known as the Cyclically Adjusted Price Earnings (CAPE) ratio or the Shiller PE ratio.

The ratio was popularized by Yale University professor Robert Shiller, author of the bestseller “Irrational Exuberance,” who won the Nobel Prize in Economic Sciences in 2013. Shiller attracted a great deal of attention after he warned that the frenetic U.S. stock market rally of the late-1990s would turn out to be a bubble.

The P/E 10 ratio is based on the work of renowned investors Benjamin Graham and David Dodd in their legendary 1934 investment tome “Security Analysis.” They attributed the illogical P/E ratios to temporary and sometimes extreme fluctuations in the business cycle.

To smooth a firm’s earnings over a period of time, Graham and Dodd recommended using a multi-year average of earnings per share (EPS) — such as five, seven or 10 years — when computing P/E ratios.

The P/E 10 ratio is calculated as follows: take the annual EPS of an equity index, such as the S&P 500, for the past 10 years. Adjust these earnings for inflation using the Consumer Price Index (CPI), that is, adjust past earnings to today’s dollars.

Take the average of these real EPS figures over the 10-year period. Divide the current level of the S&P 500 by the 10-year average EPS number to get the P/E 10 ratio or CAPE ratio.”

As the chart above shows, the PE10 moved higher than it was in the 1929 market crash and is at levels seen only during the internet bubble. That episode shows that valuations can remain high for an extended period of time.

But the risk of a decline is elevated when the PE10 is at or near record levels.

Benefit From a Potential Crash

Put options increase in value when prices fall. That makes buying a put one of the best strategies to protect against large losses. While owning a put can be thought of as an insurance policy against a market crash, the low value of VIX means the insurance is available at a low cost.

So, the strategy is to buy a put which brings us to the next decision which involves which put to buy.

There are puts available on SPDR S&P 500 ETF (NYSE: SPY), an ETF that tracks the widely followed S&P 500 index.

Buying a put that benefits from price moves in SPY should help us protect at least some of our portfolio against a bear market. The risks are limited to the amount paid for the option. The profits could be significant if the price of the underlying stock or ETF drops by a large amount.

This idea is summarized in the chart below.

long put

Source: Options Industry Council

SPY was recently trading near $275. We could try to protect 100% of our portfolio but that is expensive. And there is a risk to remember when seeking to buy protection. If the market does not crash or decline significantly before the options expire, the investor could lose 100% of the amount paid to insure the portfolio.

That risk means it might not be practical to avoid the complete risk of loss. But there are strategies that could be useful to limit the down side risk even if the risk is not completely eliminated.

A Trade to Potentially Limit Risks

There are options expiring in September 2019 available. With SPY near $275, a put with a strike price of $246 would limit the risks of a decline of more than 10%.

The September 2019 put with a $246 exercise price is trading at a little less than $5. If the stock market declines below $241, it offers a 1% gain for every 1% decline in price below that level. In other words, this put can offset the risks of a decline greater than 12%.

Buying the September $246 put protects against a market crash until September 20, 2019, the day this option expires.

Since each options contract covers 100 shares, this contract would cost about $500. If the stock market drops by 20%, SPY would be near $219 and this contract would have a value of at least $2,700. That would be a $2,200 increase in value that could offset losses elsewhere in the portfolio.

One of these puts could help protect a $25,000 portfolio against the risk of a market crash for about six months.

A $100,000 portfolio could put crash insurance in place with four contracts. This would cost roughly $2,000, or 2% of the portfolio value.

This is a relatively low cost for insurance. Of course the put can have value if the market doesn’t drop 20% and the put could be worth significantly more if the market falls suddenly shortly after the position is opened.

Right now, the market is offering investors cheap insurance. Buying a put can protect against large losses at a small cost. Buying a put option can also be a strategy that delivers a gain if there is a steep market selloff at any time over the next six months.


Did you know that dividends have rewarded investors for at least 100 years, at least since John D. Rockefeller said, “Do you know the only thing that gives me pleasure? It’s to see my dividends coming in.”

We have prepared a special report about dividends that you can access right here.