Passive Income

Overcoming the Problems of Covered Calls to Create Passive Income

EOI

Source: EatonVance.com

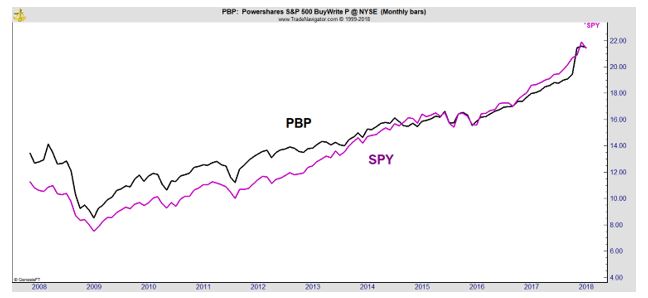
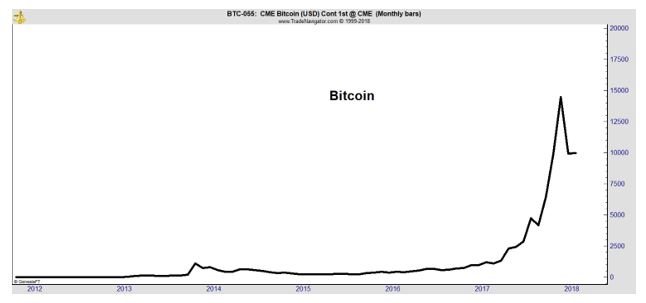
Covered calls are a well known income strategy. With this strategy, an investor sells call options on stocks that they own. They generate immediate income by selling the call which can increase the yield on their stock portfolio.

It’s an appealing strategy for income investors. But, there are a number of problems for individual investors seeking to use the strategy.

The primary problem is that this strategy requires a large amount of capital. Options trade in contracts that cover 100 shares, so an investor must own at least 100 shares of a stock to use this strategy. That can require a large amount of capital, more than many individual investors have available.

A small investor might have 100 shares or more of a low priced stock but the options premiums available on low priced stocks can be rather small. This makes it difficult to generate sufficient income from this strategy after costs are considered.

Income would also be variable, depending upon market conditions that affect the stock market’s volatility along with news and other factors unique to the stock.

In addition to these problems, investors need to consider the advantages and disadvantages of the strategy.

The advantage of a covered call strategy is that it allows investors to generate additional income from stocks they already own, assuming they own a sufficient number of shares and options are available on the stock to generate a sufficient amount of income to cover transaction costs and taxes.

But, this strategy does not do much to mitigate the risks of owning the stock. The maximum loss is limited but substantial. The worst that can happen is for the stock to become worthless.

In that case, the investor will have lost the entire value of the stock. However, that loss will be reduced somewhat by the premium income from selling the call option.

It is also worth noting that the risk of losing the stock’s entire value is inherent in any form of stock ownership. In fact, the premium received leaves the covered call writer slightly better off than other stock owners.

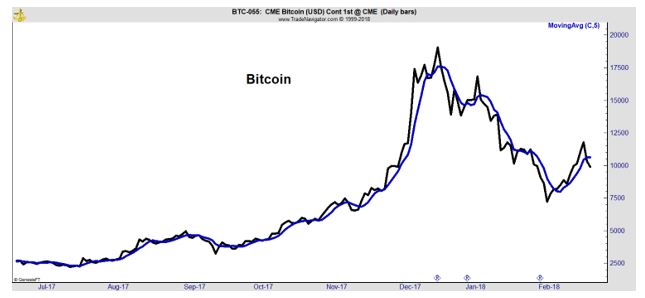
On the other hand, the maximum gains on the strategy are limited. The maximum gains at expiration are limited by the strike price. If the stock is at the strike price, the covered call strategy itself reaches its peak profitability, and would not do better no matter how much higher the stock price might be.

The strategy’s net profit would be the premium received, plus any stock gains (or minus stock losses) as measured against the strike price of the option. This is summarized in the chart below.

covered call

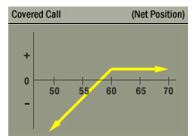
Source: OptionsEducation.org

Overall, when all of the risks and potential rewards are considered, selling covered calls is an excellent strategy for passive income but, unfortunately, the traditional approach to the strategy is largely out of reach for many individual investors.

Overcoming Those Problems With an Elegant Solution

There is a closed end fund that sells covered calls and makes the strategy accessible and affordable to any investor. A closed end fund, CEF, raises capital from investors and then invests that money on their behalf. The CEF then trades like a stock and is not subject to risks of sudden redemption.

Because it trades like a stock, the price is set by the market and the trading price can be above or below the value of the assets the CEF actually holds. CEFs often trade at a discount allowing investors to buy assets at a discount.

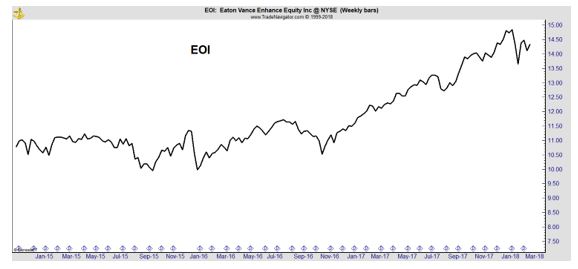
There is a CEF, Eaton Vance Enhanced Equity Income Fund (NYSE: EOI), that uses a covered call strategy. The fund holds a diversified portfolio of more than 50 individual stocks, collects the dividends form the stocks, enjoys capital gains from price increases in the stocks and sells calls to generate additional income.

The fund itself is relatively stable, showing lower than average volatility.

EOI

EOI pays a steady distribution of $0.0864 per month and has paid that amount every month since March 2012. That’s a yield of about 7.2%, well above the yield of the S&P 500 index and almost all individual stocks. The high yield comes from the covered call strategy and the fund’s structure.

As a CEF, EOI is able to return capital to investors at times to hold the level of income steady. This means some of the distribution will be tax free at times.

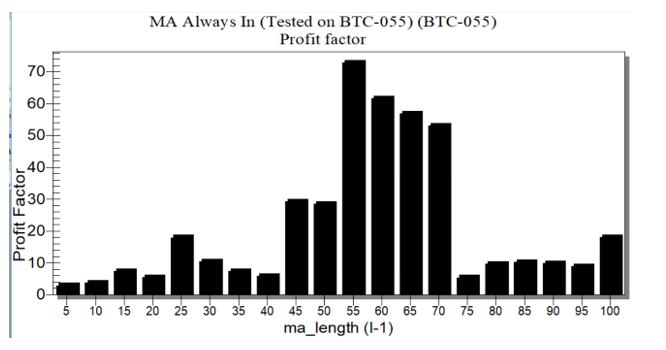
Its holdings are stable, as the chart of its largest holdings shows.

top holdings

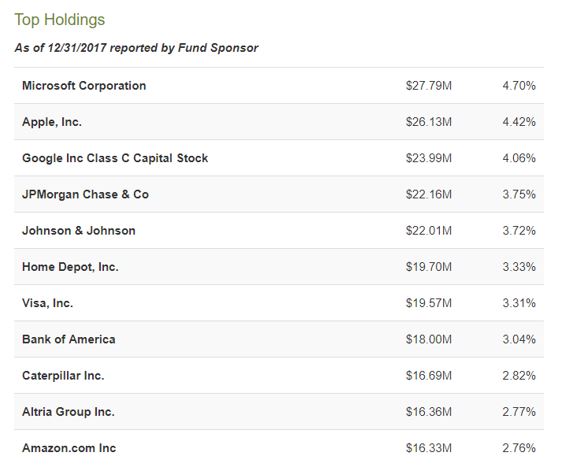
Source: CEFConnect.com

The fund is able to hold Amazon and generate income from the position by selling calls. This demonstrates the power of the Covered Call Strategies to benefit from capital appreciation while generating income even if the stock doesn’t pay a dividend.

Buying Passive Income At a Discount

Remember that CEFs trade at a market price which can be more or less than the value of their assets. Many investors limit their investments to CEFs that trade at a discount to their asset value. It’s even possible to develop a strategy that trades based solely on the discount.

A trader could buy when the discount is significantly below average and exit a position when the CEF trades at a premium or when the discount is at least narrower than it was at the time the fund was purchased. The popularity of these strategies means data on discounts is readily available.

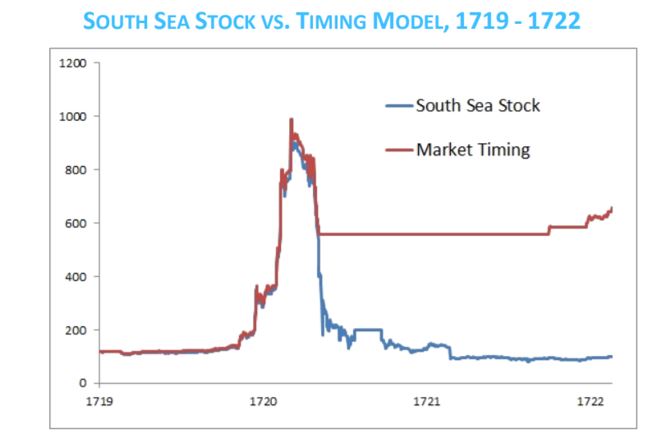
For EOI, the average discount over the past three years has been 6.57%. Now, the discount is a little lower than average at about 6.2%. But, the discount typically varies over the course of the year as the chart below shows.
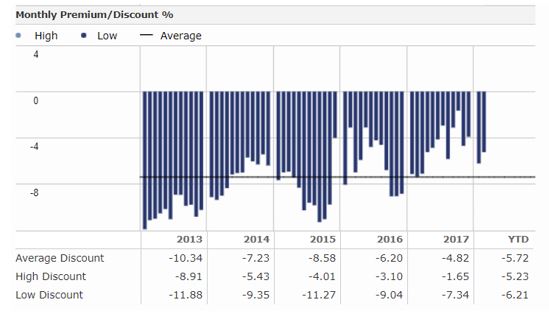
discount

Source: Morningstar

At its current discount, investors are able to buy $1.00 worth of assets for less than $0.94. That is attractive to bargain hunters and value investors.

This is a simple way to generate passive income and based on the history of the fund, the income is steady and predictable with the same amount being paid every month for almost six consecutive years. It also offers a tax advantaged income since any amount that is considered a return of capital will be tax free to individual investors.


Stock Picks

Tariff Talk Could Move These Sectors

tariff news

Stocks reacted with a sell off on what traders are calling “the tariffs announcement.” Last week, President Donald Trump suddenly announced that the United States would impose a 10% tariff on aluminum imports and a 25% tariff on steel imports.

The news came without any warning, catching both government officials and traders by surprise. According to The New York Times, the legal review of the tariffs was not completed prior to the announcement and a White House spokesman indicated a decision was weeks away.

The lack of preparation can explain why there were no leaks ahead of the announcement. Leaks can help traders prepare for news and the reaction to the news can then be muted as news is already factored in before formal announcements.

The sudden announcement that the US would impose tariffs was followed by news that European Union plans would include retaliatory tariffs on Harley-Davidson motorcycles and Kentucky bourbon and challenges to the US action at the World Trade Organization

Some analysts found the moves surprisingly specific, targeting key leaders in Congress as well as manufacturers based in the US. Roughly 95% of all bourbon comes from the home of Senate Majority Leader Mitch McConnell. House Speaker Paul Ryan is from Wisconsin, home to Harley-Davidson.

Jean-Claude Juncker of the European Commission noted, “It’s actually a stupid process that we must to do this, but we have to. We can also do stupid”

China and South Korea remained largely silent as the news unfolded, with officials saying they would be negotiating to avoid tariffs. The chart below shows how various countries could be affected by the news.

steel imports

Source: The New York Times

Relations with Canada are already strained as the country is working with the US and Mexico to make revisions to the NAFTA trade agreement. It’s possible Canada, or any other country, could be exempted from tariffs, raising the prospect of last minute changes to the decision.

The only certainty with tariffs is that there will be winners and losers. Other countries are likely to respond to the US action by imposing tariffs on US exports including, potentially, agricultural products.

Steel Could Be a Winning Sector

Steel stocks rose on the news. Among the day’s biggest winners was United States Steel (NYSE: X) which ended the day up almost 6% on heavy volume which indicates the buying was most likely broad based.

x daily

The move follows earlier gains in X that came after a strong earnings report.

Steel Dynamics (Nasdaq: STLD) and Nucor (NYSE: NUE) showed similar patterns of large gains on above average volume.

Investor’s Business Daily noted that the news may be good for steel companies but is most likely bearish for the broad stock market and the economy, saying, “The broader picture held less hope. The gains in steel stocks were not widely shared. Among IBD’s 197 industry groups, losers led winners by a 9-2 ratio.

If the stock indexes were showing a distaste for protectionism, they had economists on their side. Polls have shown that 93% of economists believe tariffs have an overall negative effect on the economy. And economists aren’t known for reaching a consensus among themselves.”

The news service also noted. “One thing to consider is that other U.S. presidents have taken protectionist measures without killing the stock market — at least not immediately.

President Reagan, for example, announced a 100% tariff on certain Japan electronics in late March 1987. The stock market then moved sideways for about six months before the crash took it down in October 1987. No one, though, has blamed the 1987 crash on tariffs.”

This means a market reaction could be delayed and traders should prepare a list of sectors to consider buying, like steel, and sectors to avoid.

Losers Could Be Many

When considering potential losers, traders need to consider a variety of information. Apple (Nasdaq: AAPL) generates a significant amount of revenue in China and could be a target of retaliation. This is true for other large exporters including Boeing (NYSE: BA) and Caterpillar (NYSE: CAT).

These companies are not only larger exporters. They are also large consumers of steel and aluminum and will face higher prices for the raw materials needed to manufacture planes and heavy equipment. Auto manufacturers are also obviously affected by higher prices on raw materials.

While many traders will focus on obvious links to tariffs, less obvious links show how almost every company in the country could be affected. New vehicles, for example, are likely to cost more.

Consumers can delay purchasing new vehicles. If tariffs are temporary and prices drop after the tariffs expire, they would be unaffected by the trade war. Some businesses may not be able to defer purchases. UPS and FedEx, for example, need to buy new vehicles on a regular basis. So do other shipping companies.

Tariffs could raise their costs for replacement vehicles and the transportation companies might then be forced to raise their prices. This would affect the prices of goods that are transported, and it is now obvious that all goods, and all businesses would be affected by the tariffs.

This would be potentially inflationary and it could also be a factor that leads to a slowdown in the economy. Higher prices and lower production would create an economic nightmare, the stagflation scenario that the country struggled with in the 1970s.

Other news sources have noted that there is absolutely no certainty on the tariffs. “The unsettled nature of a final policy was magnified by a conversation on Sunday between Mr. Trump and Prime Minister Theresa May of Britain.

Ms. May, a person briefed on the call said, warned Mr. Trump how dangerous the tariffs would be. Mr. Trump disagreed, but concluded the conversation by telling Ms. May that he had not made a final decision on what to do.”

This means traders should focus on fundamentals of individual companies as a primary factor but be prepared for the imposition of tariffs and a potential trade war. In a trade war, steel and other sectors helped by tariffs should do well while most companies will be losers.


Value Investing

Investment Lessons from a Great Economist

Few economists gain fame. When they do, it can be from an error. Irving Fisher, for example, developed the basic ideas behind the time value of money but is best remembered for saying just nine days before the 1929 stock market crash, that stock prices had “reached what looks like a permanently high plateau.”

One economist who seems to have escaped this fate is John Maynard Keynes who is widely recognized as one of the 20th century’s most influential thinkers.

ohn Maynard Keynes

Source: Wikimedia

Keynes’ theories about economics changed how governments all around the world pursue fiscal policies, beginning in the Great Depression and continuing through the current day.

Keynes argued that economies are inherently volatile and unstable, leading to recessions at times and inflation at other times. The booms and busts of the economy could be mitigated by economic policy changes including monetary policy actions by the central bank and fiscal policy actions by the government.

This leads to government spending in bad times to boost demand and ease the effects of the recession. Government restraint in good times should temper the inevitable inflation. Governments still apply this model, to some degree.

While his economic theory is still widely studied, less attention is given to his investment skills which were significant.

An Investment Wizard and Professor

A professor, Keynes was charged with managing the endowment known as the Chest fund at his Cambridge college, King’s. From the time he began managing the fund until his death in 1946, the Chest fund grew from £30,000 to £380,000, an annual rate of return estimated to be about 12%.

Sources vary, and some estimate he fared even better on behalf of the college, averaging annual gains of 15%. Either result is commendable given that the broad stock market in the United Kingdom over that time provided an average annual return of just 8%.

This success followed his initial successes speculating for his own account. In that endeavor, he turned £4,000 into a fortune worth £57,797 between 1919 and 1924, an annualized rate of return of nearly 70%.

In amassing those gains, Keynes traded stocks, bonds and foreign exchange. He maintained high levels of margin and focused on the short term. But, he was not an infallible investor. He had a reported 83% of his assets in stocks in August 1929 and suffered large losses.

In fact, Keynes performance, while overall very successful, was at times volatile as the chart below shows.

chest fund performance

Source: MaynardKeynes.org

Reports indicate that the 1929 crash led Keynes to change his philosophy. Rather than focusing on market trends, he began to study individual companies and became what we now call a value investor.

Keynes said after this change, that he wanted to calculate the “ultimate value”, to be “satisfied as to assets and ultimate earnings power and where the market price seems cheap in relation to these.”

He also believed an investor should maintain a concentrated portfolio. This is similar to Warren Buffett’s advice to place all of your eggs in a single basket and to watch the basket closely.

In Keynes’ words, “the right method in investment is to put fairly large sums into enterprises which one knows something about and in the management of which one thoroughly believes.”

Having been both a short term speculator and a long term investor, Keynes was able to summarize the difference between the two activities with stunning insight, “Investing is an activity of forecasting the yield over the life of the asset; speculation is the activity of forecasting the psychology of the market.”

Lessons From Keynes

Keynes was as quotable in his day as Warren Buffett is in our day, and his quotes allow us to develop important lessons about investing based on his philosophy. According to MaynardKeynes.org, in general, Keynes believed:

  • A careful selection of a few investments (or a few types of investments) having regard to their cheapness in relation to their probable actual and potential intrinsic value over a period of years ahead and in relation to alternative investments at the time;
  • A steadfast holding of these in fairly large units through thick and thin, perhaps for several years, until either they have fulfilled their promise, or it is evident that they were purchased on a mistake;
  • A balanced investment position, i.e., a variety of risks in spite of individual holdings being large, and if possible, opposed risks.

In other words, Keynes recommended finding value, taking a few large positions, giving the positions time to grow but cutting losses when it apparent the initial buy was a mistake and spreading risks over several sectors.

This is important advice for individual investors to consider. The importance lies in the fact that Keynes evolved to a long term investment strategy after finding a great deal of success with highly leveraged short term investments.

The evolution of Keynes’ thinking seems to be grounded in his experience in the Great Depression. Even with his extensive understanding of economics, he was unable to avoid the crash. The same is true of the other great economist of the era, Irving Fisher.

It seems to have taken the crash for Keynes to learn what may be his most quotable insight into the behavior of markets, “The market can stay irrational longer than you can stay solvent.”

In the end, Keynes described the markets as a beauty contest.

The Keynesian Beauty Contest

The economist once explained that investors should think of the stock market in the way readers should play a newspaper’s beauty contest.

In the newspaper’s contest, readers are asked to choose the six most attractive faces from a hundred photographs. The results of all entries are used to determine the six most attractive faces. The biggest vote getter is the most popular, the second biggest vote getter is the second most popular, and so on.

Readers with the highest number of correct guesses are then entered into a drawing for a prize.

Some readers will pick the six faces they find most attractive. These readers, Keynes explained, aren’t really playing the game. To maximize the chance of winning the prize, readers need to identify the six faces they believe the most readers will find attractive.

Now, some readers will go a step further, or as Keynes wrote in his 1936 classic book, General Theory of Employment, Interest and Money:

“It is not a case of choosing those [faces] that, to the best of one’s judgment, are really the prettiest, nor even those that average opinion genuinely thinks the prettiest. We have reached the third degree where we devote our intelligences to anticipating what average opinion expects the average opinion to be. And there are some, I believe, who practice the fourth, fifth and higher degrees.”

In 2011, National Public Radio’s Planet Money put this idea to the test. They asked listeners to pick what they considered to be the cutest of three cute animal videos.

Listeners were divided into two groups. One selected the animal they thought was cutest, and the other selected the one they thought most participants would think was the cutest.

test

Source: NPR

Half of the first group (50%) selected a video with a kitten. They thought that was the cutest video. In the second group, the ones predicting which video most people would find to be the cutest, 76% picked the kitten video.

NPR concluded these results were consistent with Keynes’ beauty contest theory. Individuals in the second group were generally able to disregard their own preferences and accurately make a decision based on the expected preferences of others.

After much consideration, Keynes seems to be telling us to think of beauty in the long run.


Cryptocurrencies

The Importance of Fundamentals in Crypto Markets

Many investors focus on fundamentals. They search for value in the stock market and are confident in that approach. They point to Warren Buffett as a source of inspiration and shop for bargains.

As Buffett says, “Whether we’re talking about socks or stocks, I like buying quality merchandise when it is marked down.” This approach is difficult to apply to crypto markets for two reasons.

Unlike with socks or the stocks of companies, there is no generally agreed upon definition of quality in the cryptocurrency markets as of now. Some cryptos seem to be of higher quality than others and there are ratings available on some currencies, but there is little research or agreement in the market place.

The second difficulty lies in the fact that there is no generally accepted framework to define the fair value of a cryptocurrency. For socks, the price will vary by the quality of the material used and the skill of the labor involved in making the product.

For stocks, there are textbooks defining value methodologies and the discounted cash flow model is widely taught in business schools. While there are varying assumptions about the inputs to the models, there is a general agreement about the framework for the different valuation models.

With cryptos, the lack of a definition for quality and the lack of uniform valuation models makes the question of fundamentals more difficult to address.

Not All Markets Have Fundamentals

Would you consider investing in a company that was founded with a purpose of “carrying on an undertaking of great advantage, but nobody to know what it is?” It seems unlikely because this fails the quality test and is impossible to value.

Yet, as Charles MacKay recounts in his book Extraordinary Popular Delusions and the Madness of Crowds, even though no potential investor knew what that company did, the founder collected £2,000 for the share offering and promptly skipped town never to be heard from again.

This occurred in the South Sea Bubble in the early 1700s.

The South Sea Company was a British company founded by government officials to help pay off the debt the government had amassed in fighting the War of Spanish Succession. The South Sea Company issued shares of stock to the holders of government debt.

In exchange for taking responsibility for the debt, the government gave the South Sea company a monopoly on trade with South America and continued paying 6% interest on the bonds that the company now owned.

Everyone looked like a winner in this transaction. Bond holders became share holders in the wealth being created by exploration of the New World. The government reduced its debt and interest payments. The South Sea Company had cash flow to fund wealth creating ventures in South America.

But, there was really no way to value the business opportunities in the South Sea.

A Bubble Develops

Investors in South Sea Company believed mines in South America would produce unimaginable amounts of gold that would fund other ventures and generate even more profits. This led to speculation in shares of the company.

Researchers subsequently noted, “As speculative trading in South Sea Company stock increased, other joint stock companies were launched on the London exchange.”  As Mackay recorded, some of the business plans were not well developed.

“Another company planned to build floating offshore mansions for London’s elite and yet another had a formula to harness energy by reclaiming sunshine from vegetables. These newly-floated stock issuances were called “bubbles” at the time.”

The South Sea Company experienced a rapid rise and fall, showing the pattern that would be common in other bubbles later in history.

fundamentals

Source: Wikicommons

Fundamentals had little to do with the pricing. This would be true in other markets over the next three centuries.

twelve market bubbles

Source: SSRN

This chart shows bubbles in stocks, repeatedly and around the world, currencies and commodities. Bubbles are obviously severe deviations from fundamentals and demonstrate that fundamentals do not always have a role in market prices.

The Lesson for Crypto Markets

Investors looking for fundamentals often forget that fundamentals do not have much of a role in the current price of most markets. Warren Buffett’s business school professor Ben Graham made this point with the colorful phrase, “In the short run, the market is a voting machine but in the long run, it is a weighing machine.”

What Graham meant was that fundamentals do matter in the long run. The market weighs fundamentals and determines value and that is eventually the factor that determines whether prices move higher or lower over time.

In the short run, Graham called the market a voting machine. Voting is a mix of emotional and rational responses to different factors. Consider a Presidential election in the United States to see how a voting machine can work.

The winner of the election is determined by who gets the most votes (in the United States this means the most votes in the Electoral College rather than the direct popular vote). Each vote carries an equal weight (in the Electoral College).

Voters make their decisions based on factors they weigh heavily at the time their vote is cast. The factor could be unemployment or foreign affairs in a Presidential election. The choice of candidates could be rational or emotional or perhaps even random if a voter fails to understand the process and makes a mistake on their ballot.

The truth is if the election were held a month earlier or a month later, sometimes there would be a different outcome.

This is what Graham meant about the market in the short term. Price moves can be based on rational or emotional factors. If the trading is done a day or even a few minutes sooner or later, the outcome could vary.

Markets for cryptocurrencies are like a voting machine and there is no way to know when they will incorporate weighing machines into the markets. That may never happen, but it is likely to at some point.

Knowing that means understanding fundamentals don’t impact prices of cryptocurrencies for now. Traders should focus on  technical analysis and risk management rather than employing complex valuation models.


Weekly Recap

Weekly Review

weekly review

Strategies for Trading Bitcoin and Other Cryptocurrencies

Bitcoin has captured the imagination of traders. And, there is a good reason for that. Many traders have reported large gains from bitcoin and other cryptocurrencies. That has led to interest in the markets and the question of what the markets are.

We discuss this market, as well as identify potential strategies that can be used to trade Bitcoin and other cryptocurrencies, right here.

Computer Assisted Value Investing

Value investing predates the computer. But, it is a style of investing that is readily adaptable to automation. Value investing, at its core, is simply reviewing the financial data every publicly traded company is required to report every three months.

To learn more about how you can combine value and computers in a quantitative value strategy, click here.

This Is the Best Sector For a Bear Market

Traders spend a great deal of time thinking about the markets they trade. This is natural since their success is dependent on an understanding of their market. It is also natural since trading tends to be a fairly rapid process.

With many traders concerned about a bear market, we have identified the best sector to think about. You can read about it, in this article.

Passive Income Is Built into These ETFs

Stock market investors often associate income with dividends. That is certainly one source of income for investors. If asked to name a second source of passive income from stocks, many investors would cite price gains. This is also correct. But, there are less well known sources of income in the stock market.

To learn more about these other sources of income, continue reading here.


Passive Income

Passive Income Is Built Into These ETFs

Stock market investors often associate income with dividends. That is certainly one source of income for investors. If asked to name a second source of passive income from stocks, many investors would cite price gains. This is also correct. But, there are less well known sources of income in the stock market.

Options writing is less well known and less understood but is a potential source of income for stock market investors. These strategies can be complex or could require large amounts of capital in some cases. But, there are also ETFs that now offer these strategies, making them accessible to individuals.

An ETF is an exchange traded fund which is a product similar to a mutual fund in some ways. The manager of an ETF, like the manager of a mutual fund, pools the assets of many investors to implement a strategy.

Unlike mutual funds, ETFs are priced continuously throughout the trading day and are traded just like stocks. This make them convenient and available at low costs so ETFs have become increasingly popular among individual investors. As their popularity grew, asset managers began offering more strategies in ETFs.

Buy Write Strategies With ETFs

A best option strategy involves covered call writing. This is also called a buy write strategy and involves buying a stock or index and then selling covered call options on that position. An investor could use this strategy to generate extra income on their portfolio by collecting the premium of options.

The premium is the price of the option that an investor receives for writing or selling the option. The income can increase the return but the investor who sells the option may be required to sell the shares at a predetermined price until the option expires. This means the writer gives up some potential upside on the trade when they accept the premium.

PowerShares S&P 500 BuyWrite Portfolio (NYSE: PBP) is a $330 billion ETF that uses this strategy. The fund managers explain:

“This strategy consists of holding a long position indexed to the S&P 500 Index and selling a succession of covered-call options, each with an exercise price at or above the prevailing price level of the S&P 500 Index. Dividends paid on the component stocks underlying the S&P 500 and the dollar value of option premiums received from written options are reinvested.”

Returns of PBP are compared to the SPDR S&P 500 ETF (NYSE: SPY) in the chart below.

returns of PBP

In general, the returns of the two appear to be similar to each other. There will be times when PBP outperforms and times when it lags. This is true of any strategy. But, PBP should lose less than SPY in a bear market since the fund generates income whether stocks go up or down.

That characteristic could make the fund appealing to many conservative investors. However, in an extended bull market, the underperformance of PBP could be significant. That’s because the income comes at the expense of limited upside. In a bull market, the limited upside hurts performance.

Put Writing With ETFs

WisdomTree CBOE S&P500 PutWriteStrat ETF (NYSE: PUTW) is an ETF with more than $300 million in assets that writes puts instead of calls.

This strategy involves selling put options to collect the premium. If the stock or index underlying the option rises, the writer collects the income. If the stock or index falls, the writer must buy at the predetermined price and could face a loss.

WisdomTree, the fund sponsor explains:

“The strategy is designed to receive a premium from the option buyer by selling a sequence of one-month, at-the-money, S&P 500 Index puts.

If, however, the value of the S&P 500 Index falls below the SPX put’s strike price, the option finishes in-the-money and the fund pays the buyer the difference between the strike price and the value of the S&P 500 Index.

The fund’s strategy of selling cash-secured SPX puts serves to partially offset a decline in the value of the S&P 500 Index to the extent of the premiums received.”

The next chart shows the performance of PUTW, again compared to SPY.

PUTW performance

When the market is rising, and SPY is moving higher, PUTW could provide a significant degree of outperformance since the fund is collecting premiums and not facing losses. However, in a down market, losses in PUTW could come quickly.

Benefits of Options Writing In the Long Run

A report by the Wilshire Analytics Applied Research Group analyzed returns of these strategies over a 30 year period, from 1986 to 2016. The study compared a variety of indexes that used these type of strategies. The best performer was the put write index, a strategy similar to that used by the PBP ETF.

benchmark indexes

Source: Wilshire Analytics

The next best performer was the put write strategy, the strategy that is similar to that employed in PUTW. The study noted that the strategies also had lower volatility than the S&P 500 index.

In addition to having less volatility than the broad stock market, the research from Wilshire noted that the options writing strategies had lower drawdowns during market sell-offs. This could be seen in the chart of PBP above. Wilshire noted drawdowns were reduced by about 20 years over the 30 years.

These characteristics could make these funds attractive as a source of passive income for conservative investors. Lower volatility could mean there is a higher probability of your savings being available when you need the money. Volatility is the risk your money won’t be available when needed.

Smaller drawdowns mean that many plans could remain on track. Many investors discovered that in bear markets, such as the one that began in 2008, changes to their retirement plans were necessary. They may have planned to retire in March 2009, but a steep drawdown in their accounts forced them to work several more years.

For those planning to retire at a certain time, lower returns could be preferable to large losses that come with increased exposure to aggressive market strategies. Options writing ETFs could be a smart investment under those circumstances. 


Stock Picks

This Is the Best Sector For a Bear Market

bear market

Traders spend a great deal of time thinking about the markets they trade. This is natural since their success is dependent on an understanding of their market. It is also natural since trading tends to be a fairly rapid process.

The physical action of buying and selling requires just a few seconds at a time. But, to be done well a trader needs to understand how a market will react to their orders if they are a large trader. For small traders, an understanding of the nature of the trend could be useful.

After thousands if not millions of traders have spent time studying the stock market, much is known. And many important pieces of information are distilled into short sentences that mean a great deal to successful investors.

A Market of Stocks or a Stock Market?

One of the most useful concepts for traders to understand is the idea of whether we are experiencing a “stock market or a market of stocks.” This is a common term among traders and is a succinct summary of the difficulty of trading.

In this phrase, a stock market indicates a time when the market is moving strongly in one direction and almost all stocks are participating in that trend. A market of stocks would be a time when many individual stocks are moving with the averages and many are moving in the opposite direction.

Understanding that distinction can be profitable. In a stock market, traders simply need to buy or establish a short position in the most volatile broad market average. In a market of stocks, selectivity will be the key to success.

Over time, it’s been possible to determine some general guidelines for the best time to trade a market of stocks. It seems as if the market behaves this way during a bear market. In a bull market, the majority of stocks are moving up.

Warren Buffett, an investor who is known for thinking deeply about markets and summarizing his insights into pithy comments, summarized the tendency to see a stock market rather than a market of stocks in a bull market by saying, “Only when the tide goes out do you discover who’s been swimming naked.”

There are variants of that quote and Buffett might be like the New York Yankees catcher Yogi Berra who said, “I never said most of the things I said.” But assuming Buffett made the comment about swimming naked, what he meant is that many managers confuse brains with a bull market.

In a bull market, almost all stocks are rising, and it is difficult to determine which managers are the best. The ones with the best relative performance may simply be the ones taking the most risk. When the tide goes out, in other words when the market falls, Buffett notes that we will see who is swimming naked.

This is simply because the bear market turns into a market of stocks. The best managers will deliver returns or at least lose less than the market averages. When the dominant trend is down, it may not be possible to deliver a gain, but preserving capital would be a sign of good management.

History Provides a Guide to a Market of Stocks

Knowing that bear markets will be different than bull markets, we can study the recent bear markets to determine how stock selection could be important.

Since 2000, there have been two bear markets. From March 2000 to October 2002, the S&P 500 index fell more than 42%. Then, from October 2007 to March 2009, the index fell more than 54%. We can learn from studying the sector level returns during those bear markets.

Sectors are the broadest grouping of stocks within an index. The stocks are grouped by their main business line and include different industries and subindustries.

For example, the consumer discretionary sector includes the food and staples retailing industry which includes the drug retail, food retail and food distributors subindustries. Each sector contains several industries and each industry contains several subindustries.

To begin this analysis, the table below shows performance by sector during the bear market that began in 2000.

sector performance

Consumer staples were big winners over that time. Information technology was the worst performing group. A number of sectors outperformed the S&P 500- index. We can draw a number of important lessons from this.

First is the idea that a bear market is a market of stocks. The majority of sectors beat the market which indicates that many individual stocks beat the market. That demonstrates the need for selectivity in a bear market.

Second, the bull market which preceded this bear market was characterized by a bubble in internet stocks. These companies fit into the information technology sector, the worst performing sector in the bear market. We can expect market leaders near the end of the bull market to be among the worst performers in the bear market.

Finally, consumer staples are items consumers must buy no matter what the stock market is doing and we should expect strong performance from this sector in bear markets.

We can test these ideas using data from the bear market that began in 2007. If the hypotheses listed above are correct, we should see the consumer staples near the top in performance, we should see the index near the bottom in performance based on the theory that a bear market is a market of stocks.

As to what to look for near the bottom of the list, we need to recall that the bull market that ended in 2007 was characterized by a bubble in housing. This affected the home builders which are a part of the consumer discretionary sector and financial stocks which lent to the builders.

The table below summarizes the bear market performance of sectors.

bear market performance

Once again, consumer staples top the list. Six sectors beat the index and four lagged the index performance indicating many stocks fared better than average and confirming that a bear market is a market of stocks.

The consumer discretionary sector, weighed down by home builders, and financials which lent to the home building industry, underperformed the index in the bear market. This confirmed that the market leaders at the end of the bull market will maintain a leadership position on the way down.

Looking ahead, this data tells us that now, as the bull market ages, could be a good time to invest in consumer staples stocks. The sector includes retailers as noted above in addition to food and tobacco stocks and household and personal care product makers.

These could be among the best performers, or at least the smallest losers, in the next bear market according to history.


Value Investing

Computer Assisted Value Investing

value investing

Value investing predates the computer. But, it is a style of investing that is readily adaptable to automation. Value investing, at its core, is simply reviewing the financial data every publicly traded company is required to report every three months.

Its seeming simplicity is one of the reasons value investing is so appealing. But, as any investor who has tried to implement a value investing strategy knows, the ideas are far from simple.

According to one study, there are 156 different variables that are in a complete set of financial statements that includes an income statement, a balance sheet and a statement of cash flows. That is the starting point for value investors.

Now, the variables are usually analyzed in some way and that often requires comparing the value to some other variable. For example, the popular price to earnings (P/E) ratio compares the price of the stock to the earnings information which is found on the income statement.

Another technique is to compare the rate of change of a variable over time. This could involve comparing the level of sales reported in the current quarter to the level of sales in the same three month period a year ago. Or, current sales can be compared to sales in the previous quarter.

It quickly becomes apparent that there are a number of ways the financial statements can be used. Researchers have found that there is a total of 2,090,365 possible trading signals that can be developed with simple mathematical tools.

Which of the 2 Million Is the Best?

After learning of this study, many investors may think their work is done. All they need to know is the results of this exhaustive test and they will be able to beat the market. Of course, nothing in value investing is ever as simple as it sounds.

The researchers found that 17 studies delivered statistically significant and consistently profitable results. The best performing strategy is the one that subtracts retained earnings and other adjustments from the balance sheet value of the common stock outstanding and divides that by the company’s advertising expense.

There is no logical reason this ratio should highlight winning stocks and in fact, it is almost nonsensical to believe it would. It is a result of data mining and that is the purpose of the research paper. It was designed to show that investors should not rely on computers.

This study confirms earlier research that revealed the butter production in Bangladesh, U.S. cheese production, and the sheep population in Bangladesh and the U.S. could be combined to “explain” (in a statistical sense) 99% of the annual movements of the S&P 500 between 1983 and 1993.

It’s obvious that value investing needs to begin with logic and move on to automation.

Starting With a Logical Approach

The process of value investing begins with the definition of value. Here, investors have attacked the problem in simple terms and in complex processes. Among the most popular process on Wall Street is the discounted cash flow model, or DCF.

A DCF begins with the idea that a dollar in the future will be worth less than a dollar today. That means the purchasing power of a dollar is expected to decline over time due to the effects of inflation. That means future cash flows need to be discounted to determine their value today.

DCF models include assumptions about inflation to find the value of a stock. Assumptions are then made about the future cash flows a company will generate each year and the complete process becomes rather detailed.

DCF model

Source: Wikicommons

Because of the complexity, few individual investors use DCF models. Instead of focusing on absolute valuation techniques like they use, they use relative valuation tools like the P/E ratio.

However, the P/E ratio is just one tool. There is also the price to book (P/B) ratio and price to sales (P/S) ratio. These are all popular indicators that could be used in value investing.

Relative Valuation Value Investing

To apply these tools, an investor screens for the ratio in all stocks in the investment universe and then sorts from lowest to highest. The lowest values offer the best value.

A tool many investors ignore is the EV/EBITDA ratio. This is the enterprise value (EV) to earnings before interest, taxes, depreciation and amortization (EBITDA) ratio. It includes a great deal of information and could be among the best ways to measure value.

At least that was the conclusion the authors of an upcoming paper reached. Two researchers and money managers, Wesley Gray and Jack Vogel, will be publishing “Analyzing Valuation Measures: A Performance Horse-Race Over the Past 40 Years” in the Journal of Portfolio Management.

They have already shared their results in a book, Quantitative Value. In the book, they found that the EV/EBITDA has historically been the best performing metric and outperforms many investor favorites including the P/E ratio and the P/S ratio.

Their study looked at the period from July 1, 1971 until December 31, 2010. Some results are summarized below.

average annual return

One reason the EV/EBITDA ratio may not be as popular as other tools is because it does involve more research to calculate.

The enterprise value of a company is a comprehensive measure of its market value. To calculate EV, you start with a company’s stock market capitalization (the number of shares times the market price). You then add the total amount of debt the company issued at current market value and subtract the amount of cash and cash equivalents they have on the balance sheet.

EV

These tools will require access to specialized software or a web site that can automate the process. One way to find stocks meeting these requirements is with the free stock screening tool available at FinViz.com. At this site, you could screen for a variety of fundamental factors and technical characteristics.

However, there is no guarantee any stock will be a winner. Value investors should screen for the criteria they choose and then buy several stocks that are among the lowest ranked stocks by that measure. That is perhaps the best way to combine value and computers in a quantitative value strategy.


Cryptocurrencies

Strategies for Trading Bitcoin and Other Cryptocurrencies

Bitcoin has captured the imagination of traders. And, there is a good reason for that. Many traders have reported large gains from bitcoin and other cryptocurrencies. That has led to interest in the markets and the question of what the markets are.

Cryptocurrencies Are a Market

There are several ways to think about cryptos. Some advocates of the markets insist they are a viable form of money. That means they could be used to complete everyday transactions like buying a cup of coffee. Because there is a degree of anonymity to the markets, cryptos appear to be popular for illicit transactions.

One source estimates “that approximately one-quarter of bitcoin users and one-half of bitcoin transactions are associated with illegal activity. Around $72 billion of illegal activity per year involves bitcoin, which is close to the scale of the US and European markets for illegal drugs.”

Other proponents of crypto argue they are a store of value. This argument can be based on the long term chart of bitcoin shown below.

Bitcoin

Bitcoin has been volatile but early investors in the market have been rewarded with quadruple digit gains. However, this is a fast moving and volatile market and recent entrants into the market have not been rewarded. In fact, many have losses.

While cryptos might be a form of currency and a store of value, they are also a market. A market is simply where an item is bought and sold. There is no denying crypto is a market.

Technical analysts believe the principles of that field of study can be applied to any freely traded market. They argue prices move in all markets consistent with how traders behave and think. Technicians practice in markets around the world, trading stocks, commodities, currencies and other tradables with the same general principles.

The chart below applies one of those principles, a simple moving average (MA) to bitcoin prices. The chart is indistinguishable from a chart of a stock or commodity. Prices move above below the MA, which is a 5 day MA in this chart.

Bitcoin

Moving averages can be used to create a complete trading strategies. The rules are fairly simple but various filters could be added to make the rules more selective or complex. Assuming the simplest form of the strategy, the rules are:

  • Buy when the closing price is greater than the moving average. Hold each day that the close remains above the MA.
  • Sell when the closing price falls below the MA. Hold cash until the price closes above the MA.

This is a complete trading strategy that could be followed by almost any investor. A moving average is simply the average of the closing prices over the past 5 days in this case, although any number of time periods could be used.

The average is moving because it is recalculated each day with the most recent data. If it is calculated today using the last 5 closing prices, tomorrow it would be updated by dropping the oldest piece of data and using just the five most recent closing prices.

Would a Moving Average Strategy Work on Cryptos?

Traders are skeptical by nature and often back test ideas before trading. A back test simulates the trading rules on data from the past. This is not a perfect solution to the question of whether or not a strategy will work in the future because the future will always differ from the past.

But, the past is the only data we have available to gauge the likelihood of success. As long as the rules are grounded in logic, the past will allow a trader to asses whether or not the rules are likely to be profitable.

Moving averages are logical because they are simply a trend following rule. Prices have a tendency to move in trends. When the prices are above the MA, they are in an up trend. A down trend is defined as times when prices are below the MA.

Test results for bitcoin are shown below. The profit factor is a ratio of profits to losses and value above 1 indicate a strategy is profitable. Moving average lengths from 5 days to 100 days are shown in the horizontal axis.

moving average

As the chart shows, the strategy was profitable for any of the MAs tested. Values between 45 and 70 days show the largest profit factor and that could be the length of the MA that traders could consider as a starting point in developing their own strategies.

The fact that the strategy is profitable for all MAs is a strong indicator that MAs can be used with cryptos.

But, What If This Is a Bubble?

Some will argue that bitcoin and other cryptos are a bubble. That may very well be true. But, a moving average strategy could help investors avoid the pain of a bubble collapsing as the chart below demonstrates.

sea stock vs. timing model

Source: SSRN

That chart is from a paper titled, “Learning to Love Investment Bubbles: What If Sir Isaac Newton Had Been a Trend Follower?” The chart shows that with a simple market timing strategy, investors could have avoided the large losses that followed the collapse of the South Sea Bubble.

The South Sea Bubble was among the first stock market bubbles. Sir Isaac Newton, the genius who developed the initial principles of calculus and physics, reportedly lost a fortune in the bubble. He invested early, took a quick profit, and then reinvested near the highs after watching with frustration as his friends grew rich.

In the chart above, the red line is the equity of an investor who applied a simple trend following strategy using a 10-month MA. The investor buys and holds when the price is above the MA and sells and holds cash when the price is below the MA.

This simple technique has been shown to work in a number of bubbles through history. It is likely to work in the future, even if bitcoin and cryptos are a bubble. This also demonstrates the value of MAs and shows they could be applied to cryptos as a trading strategy.


Weekly Recap

Weekly Review

weekly review

Regulators Aren’t an Existential Threat to Cryptocurrencies

There are many reasons that cryptocurrencies like bitcoin are volatile. But, one of the reasons is certainly the threat of regulation. For now, this is largely an unregulated market which presents problems and offers opportunities.

To read more about how these problems and potential opportunities impact the crypto market, Click Here.

Investing Secrets of the Witch of Wall Street

You might not be familiar with the “witch of Wall Street.” Hetty Green died in 1916 after accumulating a fortune worth an estimated $200 million, or about $4.5 billion in today’s dollars. You have probably heard of JP Morgan who lived around that same time, yet had a fortune of just $80 million.

Read more about the Witch of Wall Street and her investing secrets, Here.

This Sector Could Lead the Market Higher

Traders have been whipsawed in February as market volatility increased. The selloff which took prices of the S&P 500 Index, Dow Jones Industrial Average and Nasdaq 100 Index down by more than 10% in a matter of days seems to have ended as quickly as it began.

Which sector could lead the market higher? Find out more, Right Here.

Hard Money Lending Can Provide Passive Income

Every saver has come to understand the problem of low interest rates. Interest rates available on safe investments could be lower than the rate of inflation. This leads to a loss in buying power. This also leads many investors to chase yields by accepting more risk.

Hard money lending can produce income for you and we tell you how in our most recent article.