Passive Income

Bad News Provides a Passive Income Trading Opportunity

Wall Street

Investors know that news can move a stock. Often, the price moves that occur because of news is a short lived over reaction. When news knocks a stock’s price down, that could present a buying opportunity.

Occasionally, news will affect an entire group of stocks. That was true recently for master limited partnerships, a favorite of income investors because the group is known for its high yields.

MLPs Take a Hit Over Taxes

According to The Wall Street Journal, “A federal tax ruling dealt a new blow to a group of pipeline firms that had helped finance a massive build-out of energy infrastructure, intensifying questions on Wall Street about the sector’s survival.”

The tax ruling came from the Federal Energy Regulatory Commission, or FERC, which decided to disallow previously allowable income tax allowances. Many MLPs fell 10% or more in the news.

MLPs are a type of business structure that exists in the form of a publicly traded limited partnership. The structure is popular because it combines the tax benefits of a partnership with the liquidity of a public company.

As a partnership, profits are taxed only when investors actually receive distributions. The MLP pays no income taxes because it distributes income to its investors who pay taxes at their personal tax rate.

The selloff occurred because of concerns that the regulator’s decision reduces some of the tax benefits that made these partnerships attractive to investors seeking high income.

FERC voted to reverse a longstanding policy that allowed interstate natural gas and oil pipelines configured as pass through companies to collect corporate income tax expenses from customers.

Customers claimed it allowed pipeline owners to essentially recover income tax costs twice because regulators already allow partnerships to structure rates to ensure a sufficient after-tax return. A federal appeals court agreed with customers in 2016 and told FERC to examine the policy.

But, the Hit Might Be an Over Reaction

Several analysts were out in front of the news and highlighting the fact that the selling could be overdone. Within days of the FERC announcement, almost all of the large MLPs had issued a press release to give investors some sense of their exposure.

Companies most exposed include Enbridge Energy Partners, Spectra Energy Partners and Williams Partners, analysts wrote.

According to Matt Sallee, senior managing director at fund manager Tortoise, the average sector hit to earnings only may be around 2% and could push some partnerships to be acquired by their corporate parents.

Some companies, including Kinder Morgan Inc. and Oneok Inc. have already done just that. They previously eliminated partnerships by converting them to traditional corporations, hoping the simplified structure will make the structure easier for investors to understand which, in turn, should make it easier for the parent company to raise cash.

These conversions can be seen in the industry data. In 2014, partnerships accounted for 63% of the market value of “midstream” energy infrastructure companies, according to Hinds Howard, a portfolio manager at CBRE Clarion.

Now that’s 54%, after some large companies converted into regular corporations.

The FERC decision is likely to accelerate the conversion of older partnerships into traditional corporations, according to Height Securities analyst Katie Bays. “No question about it, for older MLPs you’re going to see a more fast-paced transition,” she said.

Sallee, the Tortoise fund manager, points out that for investors in the top income tax bracket, the net effect of corporate and personal tax changes is a wash.

While investors focus on yield, they could be missing the bigger picture on MLPs.

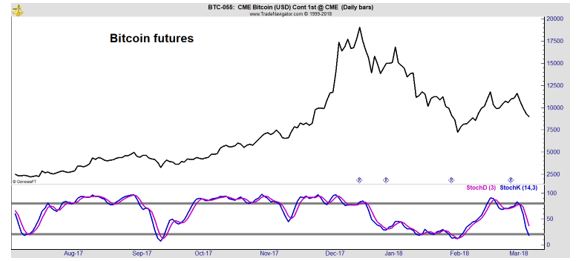
The biggest factor driving future returns is valuation, and the regulatory ruling succeeded in pushing MLPs to a level that has sparked past rallies.

The selloff led to a popular MLP index dropping to an 8% discount to the S&P 500 on the basis of price to projected funds from operations over the following year, according to FactSet.

price to funds from operations

Source: The Wall Street Journal

This has happened twice before according to the research firm. The only two occasions in the past decade that saw a similar discount, in November 2008 and February 2016, preceded rallies of 50% and 60% respectively in the index over the following six months.

Buying Into the News

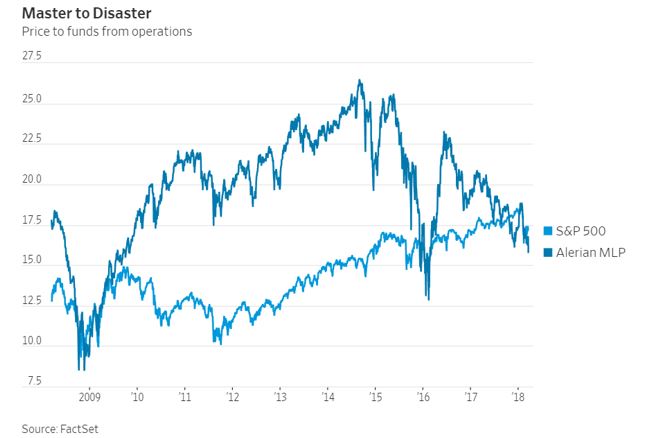
One way to obtain exposure to the sector is through an exchange traded fund, or ETF, the Alerian MLP ETF (NYSE: AMLP).

This ETF “seeks investment results that correspond (before fees and expenses) generally to the price and yield performance of its underlying index, the Alerian MLP Infrastructure Index. The fund will normally invest at least 90% of its total assets in securities that comprise the underlying index.

The underlying index is comprised of energy infrastructure MLPs that earn a majority of their cash flow from the transportation, storage and processing of energy commodities. It is non-diversified.”

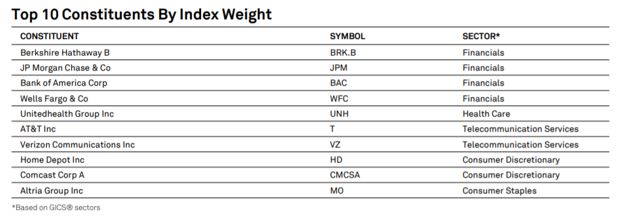
AMLP’s largest holdings could also be possible investments with exposure to the sector.

top 10 holdings

Source: Yahoo

The long term chart of AMLP shows that the ETF is near an important support level.

AMLP

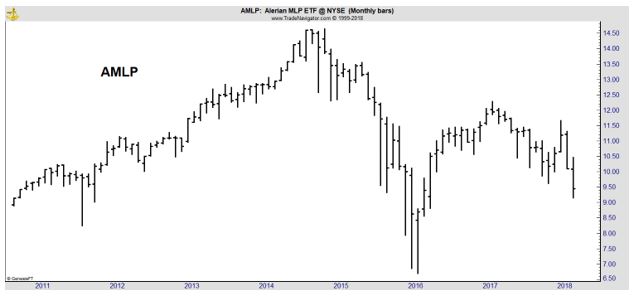
The ETF is back to its 2016 lows. The ETF’s dividend yield of more than 8% is also near a level not seen since 2016.

AMLP

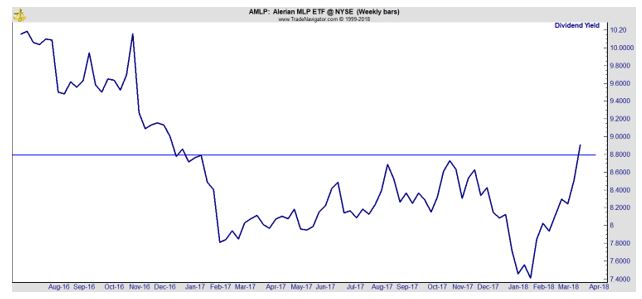
The high dividend yield could provide one source of return for the investment. The income of more than 8% is a significant level of return in the current market environment and could make the ETF attractive to investors seeking income.

A recovery in price is another potential source of return in the investment. As noted, FactSet found that when AMLP traded near this level in the past, sharp rallies developed over the next six months.

Combining the passive income of the dividend and the potential capital gains from an up move in the price, it is possible investors will enjoy a return of more than 50% in AMLP in the next six to twelve months, as they have in the past according to FactSet’s research.

There are few passive income streams with this much potential right now. That means investors should give AMLP a serious look if they are seeking passive income in a low interest rate world.


Stock Picks

Macrotrends Point to These Stocks as Potential Winners

Traders often focus on the daily moves in the stock market. They might look at the change in the S&P 500 index to determine whether or not the trend is up or down. They might then look at the list of most active stocks to find trade candidates.

This is certainly an approach to the markets that can work. But, it is also an approach that can be labor intensive and, unfortunately, many individuals don’t have as much time to spend on market analysis as they thought they did. In that case, when they discover a lack of time, they can face losses.

Losses often result when traders are unable to follow their positions or when they lack the time to react to the market news.

Longer Term Trends Can Be Profitable

If time is a concern for a trader, it could be better to step back and identify longer term trends. This can be done, for example, with a weekly chart.

The weekly chart of the dollar index is shown below. The predominant trend is down, for now. This is visible in the long term, but less obvious in short term analysis.

dollar index

Now, the dollar might seem esoteric for analyzing stocks, but, again, traders should keep ideas simple. At the highest level, according to the research firm FactSet, a declining dollar is bullish for stocks with exposure to foreign markets.

The firm writes, “companies with higher global exposure are expected to benefit from the tailwinds of a weaker U.S. dollar and higher global GDP growth.”

And, this leads to a specific trading strategy, “Based on current estimates, are S&P 500 companies with higher global revenue exposure expected to outperform S&P 500 companies with lower global revenue exposure in terms of earnings and sales growth for Q1 2018?

The answer is yes.”

To find that answer, the firm used FactSet Geographic Revenue Exposure data (based on the most recently reported fiscal year data for each company in the index).

“For this particular analysis, the index was divided into two groups: companies that generate more than 50% of sales inside the U.S. (less global exposure) and companies that generate less than 50% of sales inside the U.S. (more global exposure). Aggregate earnings and revenue growth rates were then calculated based on these two groups.”

Results of this analysis can be summarized in the chart which is reproduced below.

S&P 500 earnings

Source: FactSet

As the chart shows, the estimated earnings growth rate for all of the companies in the S&P 500 for the first quarter of this year is 17.0%. But the growth rate is not distributed evenly.

For companies that generate more than 50% of sales inside the U.S., the earnings growth rate is 16.1%. For companies that generate less than 50% of sales inside the U.S., the earnings growth rate is 19.3%.

A similar pattern of growth is seen in sales estimates. The estimated sales growth rate for the companies in the S&P 500 for the first quarter of this year is 7.2%. For companies that generate more than 50% of sales inside the U.S., the sales growth rate is 5.8%. For companies that generate less than 50% of sales inside the U.S., the sales growth rate is 11.4%.

Sectors and Stocks to Watch

The S&P 500 stocks are subdivided into 11 different sectors. The gains in earnings and sales are again not evenly distributed. The Information Technology, Energy, and Materials sectors are expected to be the largest beneficiary of the trends associated with the declining and global GDP growth.

To obtain exposure to this trend, investors could consider exchange traded funds (ETFs). An ETF provides exposure to a group of stocks in a particular sector or to all of the members of an index. Specific ETFs to consider would include:

  • Vanguard Information Technology ETF (NYSE: VGT)
  • Vanguard Energy ETF (NYSE: VDE)
  • iShares US Basic Materials ETF (NYSE: IYM)

Of course, it is also possible to trade this macroeconomic theme with individual stocks. While it seems like it could require extensive research to find the portion of sales and earnings individual companies obtain in foreign countries, indexes have already completed the research.

The S&P 500 Foreign Revenue Exposure Index is designed to measure the performance of companies in the S&P 500 with higher than average revenue exposure to regions outside the U.S. This index divides the components into two groups, those with high exposure and low exposure to foreign sales.

In this way, the index is similar to the more familiar indexes that segment the index components into value or growth. To form a value index, an index provider usually sorts the companies in the index by a metric such as the price to earnings (P/E) ratio.

The P/E ratio of all companies is found, and the list is then sorted from the lowest value to the highest. The lowest half of the values are assigned to the value index while the highest half of the values are assigned to the growth index.

In the case of foreign sales, the S&P calculates the foreign revenue exposure of all of the companies in the index and sorts from the highest to the lowest. The list of the ten companies with the highest exposure are shown in the chart below.

Index Weight

Source: S&P 500 Revenue Exposure Index Factsheet

These companies could benefit from continued weakness in the dollar and from continued growth in overseas markets. Some of the companies on the list may be a surprise. But, the data is not biased as our perceptions often are.

This list is prepared by Standard & Poor’s and is based on the data they provide to professional investors.

Of course, this list should serve as a starting point for research and additional data should be considered before making a buy decision. For example, an investor might want to check for a bullish chart pattern or for an upward trend in the stock before buying.

Investors could also use an additional valuation metric, such as the P/E ratio or expected earnings growth.

But, this list could benefit from important trends that aren’t readily apparent in the day to day market action.


Value Investing

Think About Stocks Like a Business

Wall Street

Stock market investors often think about companies in terms of their price-to-earnings (P/E) ratio or other valuation metric. But, if they were looking at their own finances or the purchase of a small business, the P/E ratio might not be the first thing they would consider.

When looking at a small business, the analysis would be more complex.

Earnings Might Not Be the Most Important Factor

Consider the valuation of local small business, perhaps a local manufacturer with $10 million in sales and reported earnings of $10,000. This might sound like a small profit. But, a deeper analysis could reveal a different picture.

You learn that the company is completing a multiyear equipment upgrade, replacing older machines with less expensive, more productive ones. The older ones are being depreciated, resulting in expenses of $2 million a year and new machines cost just $250,000.

The depreciation is lowering taxable income and capital expenditures are fully funded.

The financials also reveal the company paid a large amount of interest in the previous year, but completely paid off its debt. No similar expenses are expected in the future.

You also learn the company is located in a historically underutilized business zone and receives tax credits for that. The company also receives a number of state tax credits. These all lower the tax expense.

Now, the company’s low income seems less important. Instead, you review its cash flow from operations and attempt to understand what its normalized earnings would be, absent all of the unusual expenses and credits.

Cash Flow from Operations Could Be More Important than Earnings

This same analysis could be applied to publicly traded companies. Rather than focusing on earnings, value investors could look at cash flow from operations. This metric is found with the formula shown in the chart below.

operating cash flow

Source: SlideShare.net

A value investor will need to dig deeper on the financial statements to determine this metric. Net income and the expense of depreciation and amortization will be found on the income statement.

Changes in inventory, accounts receivables, accounts payables and assets will be on the balance sheet. Many data services will complete the calculations.

Data services obtain the information from the company’s filings with the Securities and Exchange Commission (SEC). The information can also usually be found on the company’s investor relations web site.

This will require a great deal of effort, especially when an investor is considering selecting the best investment opportunity from among several companies. The level of effort may be too intensive for individual investors.

Ignoring Earnings to Screen for Value Investment Opportunities

Value investors can use screening tools to reduce the work required to find potential investment opportunities.

One tool investors use is screening software. Online brokers offer screening tools and there are a number of web sites that allow for rapid screening of opportunities.

To begin the screening process. Investors might want to start with cash flow metrics. Free screening software sites may have limited capabilities, so it may not be possible to search for high cash flow from operations or other specific formulas. However, they should have some cash flow metric available.

For example, there is a free screening tool available at FinViz.com. The fundamental filters include the price to free cash flow ratio. Other fundamental ratios are also available.

Finviz

Source: FinViz.com

Free cash flow (FCF) is a measure of a company’s financial performance, calculated as operating cash flow minus capital expenditures. FCF represents the cash that a company is able to generate after spending the money required to maintain or expand its asset base.

The price to FCF ratio is interpreted in the same way other fundamental ratios like the P/E ratio or the price to book (P/B) ratio are. Lower values are often indicative of more value than higher values.

Low fundamental ratios can tip value investors to opportunities. Or, they could be a value trap.

A value trap is a stock that appears to be cheap because the stock has been trading at low valuation metrics such as multiples of earnings, cash flow or book value for an extended time period.

Such a stock attracts investors who are looking for a bargain because they seem inexpensive relative to historical valuation multiples of the stock or relative to the prevailing overall market multiple. The trap springs when investors buy into the company at low prices and the stock continues to languish or drop further.

To reduce the risk of a value trap, the screen above included a second filter requiring sales growth over the past five years to be at least 25%. Rising sales is an indication that the company is delivering products that the consumer demands.

Like all other fundamental indicators, rising sales are not a guarantee of a successful investment. However, combining two or more indicators should increase the probability of a successful investment.

Ignoring Earnings Can Find Value and Growth

This simple screen shows companies with cash flow from operations, low valuation and increasing sales. To demonstrate the technique, we applied the screen to the stocks in the S&P 500. The four stocks shown below are the only ones that passed the screen.

four stocks for value and growth

Source: FinViz.com


The stocks above are all attractive to value investors. Analysts expect each of the stocks to deliver growth in the next five years.

Instead of using companies in the S&P 500 filter, investors could select low priced stocks. A screen for stocks priced under $3 identified 10 potential buy candidates.

10 low priced stocks

Source: FinViz.com

Value investors seeking income could limit the screen to companies paying a dividend or a dividend above some minimum level. There are dozens, if not hundreds, of potential criteria that could be used as a starting point for research.

Screening software is a valuable tool for investors, but it can be easy to abuse this tool. For example, investors should limit the number of criteria they select. Adding too many criteria will limit the trading candidates and risks introducing errors.

Too many criteria results, effectively, to a random list of stocks. Ideally, the criteria should be limited to less than five. This will help increase the value of the investment screening software now available to all investors.


Cryptocurrencies

How to Invest in Cryptocurrency

Bitcoin

There are two very common questions about cryptocurrencies. One is “what are cryptocurrencies?” Second is “how do I invest in cryptocurrencies?” We are going to ignore, for now, the question of whether or not you should invest in cryptocurrencies. That will be the subject of another article.

Cryptocurrency is a new technology and to define what it is, it may be best to let technologies we accept as reliable define the term. Wikipedia explains it is “a digital currency in which encryption techniques are used to regulate the generation of units of currency and verify the transfer of funds, operating independently of a central bank.”

In theory, “decentralized cryptocurrencies such as bitcoin now provide an outlet for personal wealth that is beyond restriction and confiscation.”

We turned to Wikipedia for a reason. It wasn’t that long ago that the web site seemed like a new idea and many skeptics didn’t believe it could work. The idea of a crowd sourced reference site seemed likely to fail because it was new.

The fact that anyone could contribute to Wikipedia was an advantage to its proponents and a disadvantage to its skeptics. In time, the idea of decentralized knowledge collection proved workable. And, that bodes well for the future of cryptocurrencies.

How to Invest in Cryptos

Although this is a new market, it does retain some features of older markets. Central to the crypto market is an exchange, the same type of organization that facilitates investing in stocks and bonds. However, in some ways, the crypto market is more efficient than the older stock and bond markets.

For cryptos, the exchanges allow for trading and they act like the online broker an investor would use to trade stocks. This really has no impact on the user experience. The trader enters a buy or sell order and the order is executed. The mechanics of the order flow differ, but they aren’t really important to individual traders.

To open a crypto account, a trader will go to an exchange. Large exchanges include GDAX and Coinbase. There are many other exchanges, but these are among the largest. They also offer insurance against some of the risks of theft of cryptocurrencies, a real risk that cannot be ignored.

Insurance is a sign of the maturity of the market. Many exchanges have been hacked. And, the insurance provided may not protect against all losses. But, the fact that some exchanges offer some degree of protection should be considered when opening an account.

The account will generally require a cryptocurrency wallet, which is a software program that stores private and public keys and interacts with various blockchain to enable users to send and receive digital currency and monitor their balance. Blockchain is a popular wallet.

Blockchain

Source: Blockchain.com

After opening an account, you will need to verify your identity. This is required because of Anti Money Laundering rules and is a simple process that may involve uploading an image of your driver license. Online brokers like Fidelity or E*TRADE have similar requirements.

Then, you will fund your account with dollars from your bank account. This, too, should be a familiar process to stock market investors. Brokerage accounts are generally linked to bank accounts. This facilitates deposits and withdrawals to the account and prevents long delays for accessing funds.

Minimum account sizes are generally small and the exchanges are largely accessible to traders of any size.

Buying and Selling

Entering trades is a relatively familiar process for traders familiar with trading at online brokers. Coinbase, for example, offers simple order entry screens depending on how the trader is funding the transaction.


Coinbase

Source: Coinbase                                                           

The exchange screen is likely to be familiar to stock market investors. A typical screen shows recent price action and allows for trade entry.

GDAX

Source: GDAX.com

The mechanics of trading should be straightforward. To be sure they are, review trading screen at the exchange before you open an account. Reputable exchanges allow you to open an account for free and view exactly what the processes for trading and account funding are.

The question of fees should also be considered when opening an account. In general, fees will be expressed as a percentage of the transaction size and may be offset by rebates based on trading volume. Wallets may also carry fees for each transaction.

Fees, like commissions, are the cost of trading. Although they can rarely be completely avoided, every effort can be made to minimize fees. For crypto transactions, fees may be 0.25% per transaction for smaller trades and they can be higher.

Taxes, An Unavoidable Aspect of Trading

Just like with stocks, gold coins, real estate or any other investment, taxes must be paid on the profits of cryptocurrency trades.  This makes it important to consider tax reporting tools when opening an account. The tax center at Coinbase is typical and similar to online brokers.

Source: Coinbase

The tax reporting requirements for cryptocurrencies will be important for investors as they profit, or suffer losses, in the market. The IRS has expressed an active interest in the markets.

In 2014, the IRS issued a notice declaring that cryptocurrencies are property, not currencies like dollars or francs. Often they are investment property akin to stock shares or real estate.

If an investor sells a cryptocurrency after holding it longer than a year, then the profits are typically long-term capital gains. Short-term gains on cryptocurrencies held a year or less are typically taxable at higher, ordinary-income rates.

Late last year, the Internal Revenue Service persuaded a federal judge to require Coinbase, a San Francisco-based digital-currency wallet and platform with about 20 million customers, to turn over customer information.

Driving the IRS’s decision was its belief that few bitcoin investors appear to be paying taxes due on sales. The court order is one of the agency’s first moves as it clamps down on cryptocurrency scofflaws.

Taxes may not be pleasant but the prospects of large gains in the crypto markets should offset the need to forward part of the gain to the government. In addition, proper reporting could identify losses or potential deductions that could offset other income.

Overall, the market is mature enough for many investors to have confidence enough to invest in.

Weekly Recap

Weekly Review

weekly review

Applying Technicals to Cryptos

Cryptocurrencies are a new market. This is a technology that did not even exist a generation ago and is now a multibillion dollar market. However, many potential investors are still on the sidelines wondering whether or not the market carries too much risk.

It is important to remember that all markets carry risk. It is also important to remember that the level of risk is inversely proportional to the level of the potential rewards. Markets offering high rewards carry higher level of risks.

To learn more about these risks as well as potential strategies to capitalize on the rewards, Click Here.

Blood in the Street Investment Lessons

Many of us have heard the advice that “the time to buy is when there’s blood in the streets.”  There are many other versions of this saying, which appears to be a favorite among many traders, especially more aggressive traders who seem to be on the search for bloodied streets at times.

This might be useful investment advice. As Warren Buffett says in milder terms, investors should avoid market timing but, “if they insist on trying to time their participation in equities, they should try to be fearful when others are greedy and greedy only when others are fearful.”

This lesson dates back to the 1800s. You can learn more, Right Here.

An ETF Highlights Stocks to Buy

We often think of exchange traded funds, or ETFs, as investment vehicles. That is, after all, their primary purpose.

An ETF offers all the advantages of a mutual fund including professional management and a broadly diversified portfolio. ETFs also offer lower fees than mutual funds and can be bought and sold at any time unlike mutual funds which are priced just once a day.

This week we used ETFs to find several buying opportunities. You can find those, Here.

Generate Extra Income with This Hedge Fund Strategy

Stocks deliver income through dividends. These regular payments can build large fortunes over time. But, recent income from dividends has fallen to historic lows.

While dividends have been higher in the past, many investors have sought higher income. This is simply because investors will invariably seek more income no matter what the level of available income is. This means investors have put a great deal of effort into finding strategies to increase income.

We share one of those strategies, Right Here.


Passive Income

hedge fund trading strategies | Generate Extra income

Stocks deliver income through dividends. These regular payments can build large fortunes over time. But, recent income from dividends has fallen to historic lows. The chart below shows the dividend yield of the S&P 500 index.

yields since 1871

While dividends have been higher in the past, many investors have sought higher income. This is simply because investors will invariably seek more income no matter what the level of available income is. This means investors have put a great deal of effort into finding strategies to increase income.

Understand the Dividend Process

Among the strategies that hedge funds employ is the dividend capture strategy. Generate extra income with this hedge fund trading strategy. With this strategy, investors own stocks for the minimum time necessary to qualify for the dividend. It’s a fairly straightforward strategy.

Dividend payments follow a well defined process. From the time a company’s Board of Directors decide to pay share holders a dividend to the time the investor receives the funds, a chronology of events unfolds.

dividend payments

The declaration date is the day on which a company issues a statement declaring its intent to pay a dividend. At that time, the company will also announce other key dates including the record date and the payment date.

The ex dividend date is the first business day that each share will trade without its dividend. This means that investors who owned shares before and on the ex dividend date will receive a dividend once it is paid.

This date is important because investors who acquire shares after the ex dividend date will not receive the dividend.

The record date is the business day on which a shareholder that is listed in the company’s records is deemed to have ownership of the company’s shares for the purpose of deciding who can and who cannot receive a dividend when paid. The record date is typically one or two business days after the ex-date.

The payment date or payable date is the date on which a company mails or transfers dividend payments to its shareholders of record. The payment date does not have to be a business day. It can also occur on a weekend or holiday.

The Dividend Capture Strategy

To capture the dividend, an investor needs to buy the stock before the ex dividend date. They are free to sell the stock on the ex dividend date or at any time after that and they will still receive the dividend.

Theoretically, a stock’s price should reflect the expected dividend payment prior to the ex-dividend date. Because investors purchasing the stock on the ex-dividend date do not receive the dividend, the price of the stock should theoretically fall by the dividend amount.

In theory, the price of a stock falls by the amount of the dividend on the ex dividend date. However, this doesn’t always happen in the market, especially since much of the buying in the market is driven by index funds and the value of the stock is irrelevant to these investors.

That creates the trading opportunity.

Consider a hypothetical stock, ABC Company, trading at $10 a share paying a dividend of $0.50 a share. A trader could buy the stock at the close on the day before the ex dividend date. In theory, the stock should open after the dividend is paid at $9.50 but assume a strong employment report boosts the stock to $9.75.

The dividend capture strategy trader now sells for $9.75. They capture the dividend of $0.50 and realize a profit of $0.25 per share for a one day holding period.

This strategy benefits from the fact that stocks do not trade in strict accordance with theory.

Benefits of the Dividend Capture Strategy

The obvious benefit of this strategy is that the trader generates significant profits in trades with a short holding period. Shorter holding periods can reduce risk since there is less time exposure to the stock market.

This strategy can also be implemented in any sector or with any size of stock. A free stock market screening tool at FinViz.com recently showed that there are 3,796 dividend paying stocks that could be used with this strategy, more than half of all publicly traded stocks.

Drawbacks of the Dividend Capture Strategy

Although this strategy has limited exposure to the risk that news will prompt a broad stock market sell off, there are some drawbacks that investors should be aware of.

One of the drawbacks is that the short holding period of the strategy could result in unfavorable tax treatment of the income. To count as a “qualified” dividend that is eligible to receive favorable capital gains tax treatment, the stock must be held for at least 60 days during the 121 day period that begins prior to the ex-dividend date.

This strategy will not qualify for that benefit. Employing the strategy in a tax advantages account could overcome this problem. Or, taxes may not be a concern for all investors.

Finally, commissions could eat into the profits. This problem could be addressed by using a low cost discount broker. At deep discount brokers, commissions can be less than a dollar and trivial to the results of an active trading strategy.

Finally, this strategy can be capital intensive. Traders must buy the shares since that is the only way to obtain the dividend. Low cost call options will not work with this strategy.

The dividend capture strategy can be used successfully by short term traders seeking income as long as they have sufficient capital to execute the trades. Alternatively, they could limit their trading operation to low priced stocks.

FinViz.com recently showed that there were 134 dividend paying stocks priced at $5 or less. This means the strategy could be used by investors with relatively small amounts of capital since 100 shares of these stocks would require capital of $500 or less.

If using low priced stocks, investors need to consider the liquidity of the stocks. Stocks with low liquidity can be more expensive to trade and it is even possible a trader could be unable to sell the shares when desired at a reasonable price. This is an important risk to consider.

However, even with the risks, the dividend capture strategy could be appealing to investors seeking higher than average levels of passive income.


Stock Picks

An ETF Highlights Stocks to Buy

We often think of exchange traded funds, or ETFs, as investment vehicles. That is, after all, their primary purpose.

An ETF offers all the advantages of a mutual fund including professional management and a broadly diversified portfolio. ETFs also offer lower fees than mutual funds and can be bought and sold at any time unlike mutual funds which are priced just once a day.

The professional management of the fund can also help us find potential trades. ETFs are generally managed to track an index. This means managers must buy and sell stocks that are in the index to match the cash flows of the fund.

Despite the fact that they are indexed, ETFs can offer useful information for traders looking for potentially top performing stocks. This is a simple form of momentum analysis.

A Top Down Approach to Analysis

Researchers have extensively studied the momentum factor in the stock market. What they have found is that the stocks that have been among the best performers in the past six months tend to be among the best performers in the next six months.

Likewise, stocks that have been among the worst performers in the past six months tend to be among the worst performers in the next six months. This is a generalized description of momentum, meaning stocks tend to follow their existing trend.

This is, of course, a broad generalization of tendencies. There is no guarantee any single stock will maintain its momentum but over the long run, a portfolio of stocks is expected to maintain its momentum and this tendency can deliver market bearing results, in the long run.

The momentum factor is shown in the chart below from Dr. Kenneth French’s web site. French, along with Nobel Prize winning economist Dr. Eugen Fama, developed the market model that includes the momentum factor.

Dr. Kenneth French

Source: Dr. Kenneth French

This chart shows that small cap stocks with high momentum deliver the best returns in the long run, followed by high momentum large cap stocks, small call stocks with low momentum and, finally, large cap stocks with low momentum.

Momentum can help us identify potential winners in a number of ways. One way is to start with the list of top performing ETFs.

Among the market leaders, we find iShares Latin America 40 ETF (NYSE: ILF). While most major world stock markets are lower or slightly higher this year, Latin America has emerged as a pocket of strength.

Brazil’s Bovespa is up about 13%. That gain helps explain the success of ILF, one of the most widely held ETFs offering direct exposure to Latin America. ILF holds nearly $1.9 billion in assets. The fund is up about 12% in 2018, significantly more than the S&P 500 and other major world index ETFs.

Digging Deeper into ILF

The ETF owns 40 of the largest companies in the region, blue chips that are selected for their investment appeal, fundamentals and liquidity. The portfolio is concentrated on financials, with about 36% of assets in that sector. Materials, energy and consumer staples account for 14% to 17% each.

Geographically, iShares Latin America 40 is almost exclusively weighted on three countries: Brazil is 60% of the fund, Mexico 22% and Chile 11%. Peru and Colombia have small participation and are the only other nations in the portfolio.

As far as individual holdings, Brazilian stocks have been the largest contributors to the fund’s performance. Oil giant Petrobras (NYSE: PBR) is one of those stocks.

PBR

PBR has been in an up trend, tracking the price of oil and also trading higher on efforts by politicians to reform the government in Brazil in an effort to boost economic growth.

Another large holding of ILF is Itaú Unibanco Holding S.A. (NYSE: ITUB), a subsidiary of Itausa that’s also Brazil’s largest bank. This stock is also consolidating gains after a recent up trend.

ITUB


The banking sector is one of the largest in the Brazilian stock market and stocks in that sector represent more than a third of the benchmark stock market index for Brazil, the Bovespa index.

According to Humberto Garcia, head of global asset allocation for Bank Leumi USA, the financial sector in Brazil should benefit from better credit quality in consumer and commercial and industrial portfolios of the banks.

“We are very bullish on Brazil as it steadily emerges from its deepest recession ever and from a wave of bribery scandals that introduced uncertainty across industry sectors,” Garcia told Investor’s Business Daily.

He added, “Consumer confidence is improving and inflation is under control at under 3.5%, so people are out buying. Purchases of autos and durable goods were on a steep ascent throughout 2017 and reflect pent-up demand from the hard years.”

ILF also has significant exposure to Mexico. Here, the outlook is less certain with the presidential election scheduled for July 1 and NAFTA negotiations threatening to upend industry and trade with the US, its largest trading partner, according to Garcia, the Bank Leumi USA  analyst.

Still, he believes Mexico’s economy will continuing growing, expecting growth to be about 2% this year, repeating the level of performance delivered last year.

“A quick look at GDP data shows strength in machinery and equipment manufacturing, retail, transportation and finance,” he added. “Restaurants, food and beverages all seem to be doing well. After several years of increase, domestic auto sales were down in 2017, which reflects the similar downward trend in consumer confidence.

For both Brazil and Mexico, energy production is strategically important but a small part of the countries’ economies.

Garcia notes, “State-owned Petrobras produces and also imports oil for its refineries, so rising oil prices help and hurt.” For Mexico’s Pemex, which is also government owned, exports amount to only a small percentage of GDP.

Among the market leaders for the Mexican stock market is America Movil (Nasdaq: AMOV).

AMOV

America Movil is the largest wireless carrier in Latin America and Mexico is its largest market. The company generates approximately 30% of its wireless sales in Mexico and has an estimated market share of 65%.

These are all stocks that can be found with a top down analysis that begins with a list of top performing ETFs.

Value Investing

Blood in the Street Investment Lessons

Many of us have heard the advice that “the time to buy is when there’s blood in the streets.”  There are many other versions of this saying, which appears to be a favorite among many traders, especially more aggressive traders who seem to be on the search for bloodied streets at times.

This might be useful investment advice. As Warren Buffett says in milder terms, investors should avoid market timing but, “if they insist on trying to time their participation in equities, they should try to be fearful when others are greedy and greedy only when others are fearful.”

No matter how the lesson is explained, it appears to date back to the early 1800s and is widely attributed to the founders of the Rothschild dynasty a family that grew a small banking business into one of the most successful financial firms in history.

As The Telegraph records the story, “The family’s banking dynasty has had a presence in London since 1811, when Nathan Mayer Rothschild, along with his four brothers, was instructed by their father to expand the family’s banking business across Europe.”

Nathan Mayer Rothschild

Nathan Mayer Rothschild (Wikipedia)

The family made a fortune buying and selling government bonds along with gold and silver bullion, often using arbitrage trades. They would buy in the city where the bonds or metal was cheapest and sell in the city offering the highest price. Their branch system allowed for this to be done quickly and cheaply.

But, it was during the Napoleonic Wars when Nathan found his greatest opportunity. He supported the British forces and the Duke of Wellington and lent a large amount of money to the English troops fighting Napoleon.

When the war was over, and Napoleon was defeated, the family business was repaid, and the profits were significant. But that was just one source of wealth for the family at that time. They also speculated on the stock market.

And, according to The Telegraph,  “as the armies closed in for the final confrontation at Waterloo, Nathan’s family connections gave him a crucial advantage.

In an age before the instant transmission of information across the world, the Rothschilds had a network of agents across Europe in place to send news of key events such as the battle back to London. On the afternoon of June 18, 1815, Nathan learnt of Wellington’s victory.

Realizing that other investors remained ignorant of the battle’s outcome, he sold heavily on the stock market. Other traders followed suit. But later the same day, still before other investors had learnt of Wellington’s victory, Nathan quietly bought almost the entire stock market at incredibly low prices. When the news eventually emerged, the market rocketed, netting Nathan a fortune.

Battle of Waterloo

Battle of Waterloo (Wikipedia)

He is said to have coined the maxim “Buy on the sound of cannons, sell on the sound of trumpets”.

The Next Two Centuries

Although the Napoleonic Wars provided a source of wealth, the family’s business interests continued to grow after that. The bank would allow Great Britain to buy a controlling stake in the Suez Canal and would finance large holdings in future giants such as mining company Rio Tinto and diamond firm De Beers.

Even today, the Rothschild’s family owns a collection of banks, property and investment management firms. One firm, RIT Capital Partners, allows small investors in Great Britain to invest alongside the family.

RIT Capital Partners

The firm was set up to manage some of the wealth of the Rothschild family and was eventually floated on the stock market as an investment trust in 1988, holding £281m in assets at that time.

Lord Jacob Rothschild, the chairman of the trust, today holds a personal stake of more than 20% in the company, which has now a market value of more than $2.5 billion.

Since 1988 the trust has delivered, on average, returns of about 12.4% a year, serving as what it calls a “wealth preservation vehicle,” that is focused on trying to protect investors’ capital when stock markets fall. This means that the trust is likely to underperform when the there is a strong bull market in stocks.

The firm provides a list of its investment objectives stating that they “aim to participate in markets when they are rising but adopt a more cautious stance when we see risks of capital loss.”

This is done by “retaining liquidity at the right times and preserving shareholders’ capital takes precedence over short-term capital growth.”

To accomplish these goals., the fund uses a multi-asset approach including investments in property, gold and publicly traded equities. Currency exposure is also actively managed to avoid risks of loss due to changes in currencies.

Applying These Lessons

Individual investors can obviously learn a great deal from a family that has grown its wealth for more than two centuries.

One lesson is that now might not always be the best time to buy. The strategy described by “buy on the sound of cannons, sell on the sound of trumpets” means it could be best to buy on bad news and sell on good news. This is also called “contrarian investing” because it requires moving contrary to popular opinion.

Another lesson is to maintain a source of cash for those times when it is important to buy. This could involve holding a cash reserve or being willing to use margin as a source of liquidity when the market is particularly undervalued.

But, when the opportunity presents itself, investors must act. They may be wrong and risk management strategies should be in place. But, important events often provide short term trading opportunities few investors fully seize.

A final lesson is to diversify. The Rothschilds were among the first to employ geographic diversity as a strategy with branches of the family businesses scattered around Europe and exposed to different risks. Different branches even financed different armies at war with each other.

Diversification should be broad, including different asset classes whenever possible. Geographic diversification, investing beyond the United States if you are a US citizen, should also be considered. Different parts of the world will always offer different types of returns to investors.


Cryptocurrencies

Applying Technicals to Cryptos

crypto

Cryptocurrencies are a new market. This is a technology that did not even exist a generation ago and is now a multibillion dollar market. However, many potential investors are still on the sidelines wondering whether or not the market carries too much risk.

It is important to remember that all markets carry risk. It is also important to remember that the level of risk is inversely proportional to the level of the potential rewards. Markets offering high rewards carry higher level of risks.

This relationship explains why the stock market delivers larger average returns over the long run than a money market fund. The money market fund carries almost no risk in the sense that a significant amount of the original investment is unlikely to be lost. Safety provides low income.

On the other hand, the stock market presents a larger risk. Stocks can, and often do, decline in value. This means the investor should receive a greater reward, on average and in the long run, to accept the higher degree of risk.

Crypto markets carry even more risk than the stock market. This can be seen in volatility that results in prices moves of 10% or more in a single day at times. We generally see a move like that in the stock market requiring months to unfold.

The great risks of the crypto markets carry high potential rewards for the investors in those markets. Fortunately, there are some tools that can be used to manage the risks of the markets.

Apply Momentum Indicators to Crypto Markets

The MACD is one of the most popular technical indicators. It is widely available on a number of free web sites and is frequently shown on charts. While the indicator is widely applied to the stock market and to individual stocks, it is less widely applied top crypto markets, even though it could be.

Formally, MACD is the Moving Average Convergence-Divergence indicator. It’s been available to traders since at least the 1970s when Gerald Appel began writing about it. The indicator is most commonly viewed as a series of bars, like the ones shown below prices in the chart below.

Bitcoin futures

The indicator consists of two lines. One is slow (%K) and the other is fast (%D). The calculation is, of course, done for us at many free web sites including StockCharts.com and TradingView.com. An example of the calculation is shown in the chart below.

Bitcoin futures

Because of the way it is calculated, the indicator will always have a value between 0 and 100. It will oscillate around 50, the midpoint. Movement around a midpoint makes stochastics an oscillator. The fact that it is bounded within a range allows us to create rules defining when we should expect a reversal.

In the chart above, %K is shown in blue and %D is shown in magenta. This interpretation is equivalent to the way a moving average would be interpreted.

When the slow line is above the fast line, the trend is up. Think of price (the fast line) and a moving average (a slow line) to visualize this relationship. When the fast line is above the slow line, the trend is down.

Crossovers are just one way that stochastics are used. The indicator also identifies potential trend reversals when it becomes overbought or oversold. An overbought condition exists when momentum has moved up too fast and an oversold extreme occurs when momentum falls too fast.

In the chart above, extremes are marked with solid grey lines. The oversold level for stochastics is usually set at 20. Overbought is defined as reading above 80. The idea is that prices are due to decline when the indicator moves above 80. A reading below 20 is believed to indicate a rally in prices is imminent.

Buying when stochastics is oversold would have been profitable in the past.

These simple and popular tools can be readily applied to crypto markets and could reduce risk for traders who would then know when they should sell and hold cash in the markets.

You can read more about cryptocurrencies, here


Weekly Recap

Weekly Review

weekly review

The Importance of Fundamentals in Crypto Markets

Many investors focus on fundamentals. They search for value in the stock market and are confident in that approach. They point to Warren Buffett as a source of inspiration and shop for bargains.

As Buffett says, “Whether we’re talking about socks or stocks, I like buying quality merchandise when it is marked down.” This approach is difficult to apply to crypto markets for two reasons.

Read about those two reasons here.

Investment Lessons from a Great Economist

Few economists gain fame. When they do, it can be from an error. Irving Fisher, for example, developed the basic ideas behind the time value of money but is best remembered for saying just nine days before the 1929 stock market crash, that stock prices had “reached what looks like a permanently high plateau.”

One economist who seems to have escaped this fate is John Maynard Keynes who is widely recognized as one of the 20th century’s most influential thinkers.

You can learn more about this influential thinker in this article.

Tariff Talk Could Move These Sectors

Stocks reacted with a sell off on what traders are calling “the tariffs announcement.” Last week, President Donald Trump suddenly announced that the United States would impose a 10% tariff on aluminum imports and a 25% tariff on steel imports.

The news came without any warning, catching both government officials and traders by surprise. According to The New York Times, the legal review of the tariffs was not completed prior to the announcement and a White House spokesman indicated a decision was weeks away.

To find out which sectors could be impacted by tariff talk, click right here.

Overcoming the Problems of Covered Calls to Create Passive Income

Covered calls are a well known income strategy. With this strategy, an investor sells call options on stocks that they own. They generate immediate income by selling the call which can increase the yield on their stock portfolio.

It’s an appealing strategy for income investors. But, there are a number of problems for individual investors seeking to use the strategy.

Find out more about these problems and explore the solutions in our latest article.