Generate Income Like a Music Star

“Telephone number checks” is one way to describe the income some performers make from royalties. These are checks containing seven digits, as long as a telephone number. Of course, there are a relatively small number of individuals who earn telephone number checks.
But, there are many performers who enjoy smaller royalty streams. They may write a song which gets picked up as the theme song for a television program that airs five days a week, something like ABC’s Good Morning America.
It’s important to remember that royalties are generated every time a song is played, whether the song is played in a concert, by a local band in a public performance, streamed through a music service, on a television show, commercial or movie, or any other venue.
Well, there was an opportunity to invest in that theme song. The writer’s share of a catalog of songs including the theme music used in ABC’s flagship news programs: Good Morning America, This Week, and America This Morning, was recently auctioned.
Specifically, the auction entitled the winner to receives 50% of the writer’s share of public performance royalties for those songs.
The auction notes highlighted the fact that “this catalog’s earnings have grown 273% in the last four quarters over the four previous quarters. In the last 12 months, this collection of theme music produced $11,317 in royalties.”
Assuming no upside, that’s an income stream of more than $5,600 a year and the payouts would last for the lifetime of the author plus 70 years. This is an asset that could require you to create an estate plan.
Now, the winning bid for that auction was $60,000, a yield of 9.3% for the current payout. But, there are many other auctions and there are always new opportunities.
A New Asset Class for Income Investors
The Royalty Exchange explains the value of these type of investments.
Intellectual property assets with a strong track record of consistent earnings may be the perfect investment for those seeking income. Owners of intellectual property of any kind are paid every time their IP is used. They create an asset once, and then collect payment over and over again.
Billy Goodrum, for example, wrote original music for the hit comedy Dumb and Dumber (1994), among others. Below, you can see that the royalties he earned from that movie increased at least 15% every year from 2011 through 2014, ultimately reaching a 12-month total of over $22,000 before he sold it in early 2015.
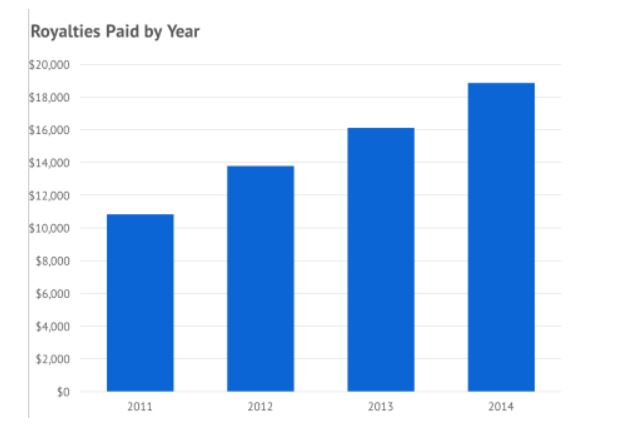
Source: Royalty Exchange
Royalty Exchange was founded in 2011 to help artists raise money and take control of their financial future. Creators enjoy a powerful new way to fund their career. Investors can generate income that’s hard to beat.
Even before 2011, royalties were available to investors. But, “royalty transactions took place in private. They were available only to industry insiders who held all the cards.
This kept prices low and values cloaked in mystery. Deals were all-or-nothing, take-it-or-leave-it offers. Only the biggest and richest creators could attract interested buyers. And private investors lost out on opportunities for significant returns.”
Now, there are fully transparent auctions that any investor can consider.
The site reports that over 22,500 investors are registered for auctions. Since 2016, creators have raised over $14 million on Royalty Exchange.
A Recent Auction
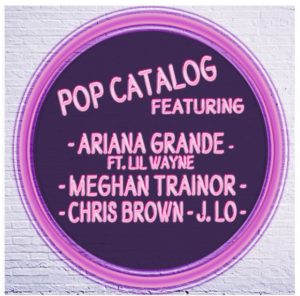
Source: Royalty Exchange
Music fans may be familiar with names like Ariana Grande, Jennifer Lopez, Meghan Trainor or Chris Brown. They many not know they could earn money when they hear one of those songs.
Potential investors can see a complete listing of the songs included in the catalog and the terms of the auctions were clear.
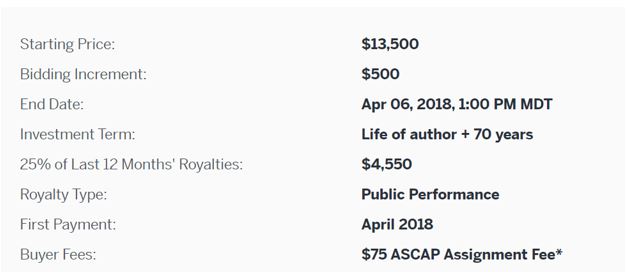
Assuming income of about $1,100 a year, the minimum income would be about 8% a year. An investor could determine the value of the income stream to them, perhaps it would be 5% a year. Dividing the expected initial income by the minimum required return would indicate this could be worth $22,000.
It might be reasonable to limit the bid to just 70% of that amount to provide a margin of safety. Of course, there is no guarantee the income stream will remain at the recent level.
A New Opportunity For Individual Investors
A recent product innovation is the Peer Advance. This type of opportunity occurs when future proceeds are pledged to an investor at a stated interest rate.
As one example, the classic song “These Boots Are Made for Walkin'” was recently ensured of a royalty payment of $56,250 that would be payable in September 2018. The owner wanted funds earlier and offered a return of 9.75% for a 10 month loan, secured by the rights.
In other deals, the returns are fixed but the time period is variable. One recent deal gave investors the opportunity to receive the next $25,000 in royalty payments on a catalog of songs recorded by Earth, Wind and Fire.
The investor would pay $18,750 for the right to collect the seller’s royalty income until the investor receives a total of $25,000. The total return equals the Advance Amount plus a 33% return ($18,750 x 1.33 = $25,000).
With this investment, the variable is not the amount of return the investor can expect. The investor will receive all royalties generated until the total return is achieved.
Instead, the variable is the amount of time it takes for the investor to receive the full Repayment Amount. The investor will receive $25,000 in royalty payments. The only question is how long it will take.
If future quarterly payments equal the average of the last four quarters, the investor will receive the Repayment Amount in 24 months. That’s approximately a 15% Annual Rate of Return.
If future quarterly payments equal the most recent quarterly payment, the investor will receive the Repayment Amount in 27 months. That would generate approximately a 14% Annual Rate of Return.
There is risk, but there is also the possibility of above average returns. Uniquely, there is also an opportunity for bragging rights the next time a song you own an interest in comes on the radio.