Passive Income

Income and an Inflation Hedge, In an Obvious and Overlooked Area

timber

Inflation is a growing concern. The truth is that inflation has been a concern for decades. One of the most significant differences between a typical bout of inflation concerns and the current round is that inflation pressures are building.

The chart below shows the year over year change in the producer price index (PPI) over the past five years. The trend is now clearly up.

year over year change in the producer price index

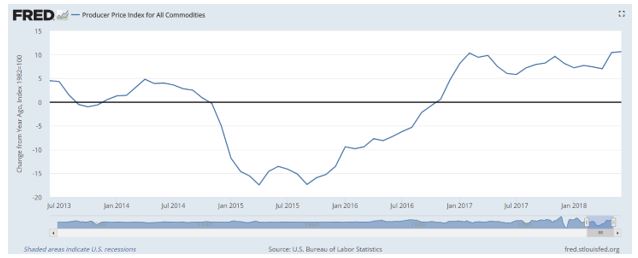
Source: Federal Reserve

The PPI measures the average change over time in the selling prices received by domestic producers for their output. The prices included in the PPI are from the first commercial transaction for many products and some services. It’s designed to measure inflationary pressures that are in the pipeline.

With inflation pressures building, many income investors should be increasingly concerned. As inflation rises, interest rates should rise. Higher interest rates should lead to declines in the prices of fixed income investments.

This means investors could be left with the low income associated with investments in low interest rate instruments and declines in the prices of those assets. It’s a significant problem with a loss of both income and principal threatening the portfolios of fixed income investors.

Inflation Hedges Could Benefit Income Investors

Inflation hedges are generally considered to be assets that can move higher in value as inflation rises. Historically, gold has served as an inflation hedge. That means gains in the price of gold should keep up with the prices of everyday items in the long run. This idea is supported by at least one study.

inflation hedges

Source: ZeroHedge

But, gold is speculative in nature in the eyes of many investors. Warren Buffett has been in that camp and made several comments on gold as an investment in his annual letter.

What motivates most gold purchasers is their belief that the ranks of the fearful will grow. During the past decade that belief has proved correct. Beyond that, the rising price has on its own generated additional buying enthusiasm, attracting purchasers who see the rise as validating an investment thesis. As “bandwagon” investors join any party, they create their own truth – for a while.” Berkshire Hathaway 2011 Shareholder Letter, p. 18.

Is Buffett right, as he so frequently is? The answer depends on the investor’s perspective. Because gold has little use in industry, there is a speculative component to its price. If an investor is concerned that speculators might abandon gold, they could consider other potential inflation hedges.

Among the potential hedges to consider could be a home. Home prices tend to appreciate about 1% a year, in the long run, after inflation. Home prices also tend to hold up well in stock market downturns.

According to Barron’s, “During the Great Recession, of course, the real estate market collapsed along with stocks. But residential real estate’s performance during the 2007-2009 bear market was anomalous, according to data from Yale University’s Robert Shiller, winner of last year’s Nobel Prize in economics and the co-creator of the Case-Shiller Home-Price Index.

In 14 of the 15 previous U.S. equity bear markets, going back to 1956, the home-price index rose. And in that lone bear market prior to 2007 in which home prices did fall, they did so by just 0.4%.”

However, homes might not be a reasonable investment option for many investors. Many will already own their own home and be reluctant to take on additional costs of home ownership. That doesn’t mean there are no options available to them. They could look at a component of the home.

Lumber is a commodity that is used in home construction.  Investors could gain direct exposure to lumber through the futures market. However, futures are a risky investment that many individual investors may not be well suited to trade.

Individual investors could also gain exposure to lumber through real estate investment trusts, or REITs. The investment management firm Invesco recent commented on timer REITs, or REITs that own timber land:

“Timber REITs are currently experiencing strong rates of cash flow acceleration thanks to a strong US economy, improving housing starts and the surging price for timber. Each of the above companies has between 2 million and 12 million acres of working forests across many states, and they can provide wood for use in a variety of markets including lumber, pulp, paper and other wood-based products.4

Bottom line: On the lumber and panel front, we expect housing starts to continue to rise in the next several years as more millennials form new households. This should continue to be supportive of timber REITs.”

A Specific Strategy

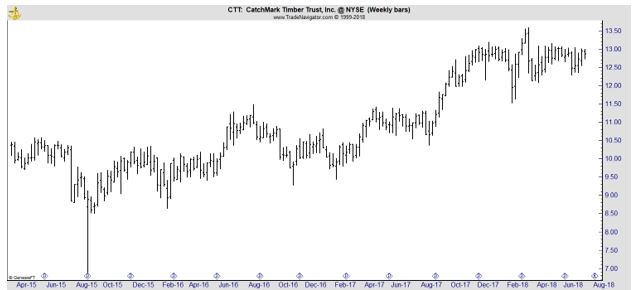
CatchMark Timber Trust, Inc. (NYSE: CTT) is an example of a timberland REIT. This REIT currently yields about 4.2%.

CTT is a self-administered and self-managed real estate company investing in timberlands. The company is engaged in the ownership, management, acquisition and disposition of timberland properties located in the United States.

CTT owns interests in approximately 499,600 acres of timberlands in the United States. Its timberlands included approximately 74% pine stands and 26% hardwood stands. This property generates income which supports the yield.

The stock chart of CTT shows little volatility, meaning the REIT could protect capital in a market downturn. It should deliver gains if lumber rallies as it has recently.

CTT weekly chart

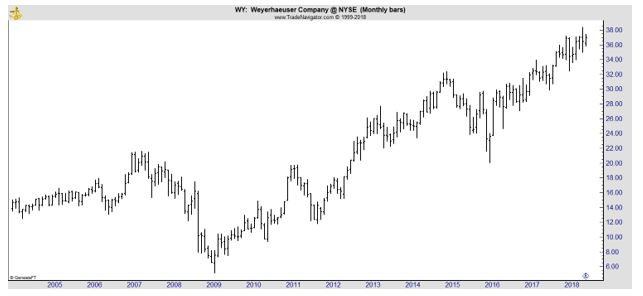
Another alternative to gain access to timber is with an operating company, Weyerhaeuser Company (NYSE: WY), a timber, land and forest products company. WY owns or controls 13.1 million acres of timberlands, primarily in the United States, and manages additional timberlands under long-term licenses in Canada.

The company manages these properties and also manufactures and distributes wood products, including softwood lumber, engineered wood products, structural panels, medium density fiberboard and building materials distribution.

The stock has been among the market leaders since bottoming in 2009.

WY monthly chart

Rising rates will almost certainly have an impact on income investors. While some may welcome the higher income rising rates will bring, other investors will suffer losses on fixed income investments they already own. Inflation hedges, like timber, could provide wealth protection and income in this environment.


For additional investing tips and products, click here.

Stock Picks

A Whole New Group Develops in the Stock Market

athleisure

Investors sometimes think of groups as relatively unchanging. There is the mining sector, the railroads, auto makers and other clearly defined groups of stocks. The truth is that at one time, all of these were new industries and it took time for the companies to grow into a group.

In recent years, several new industries have appeared. Their appearance is largely due to consumer demand rather than specific inventions which led to new industries in the path. Among the new groups is the athleisure sector.

This is a fashion trend where clothes designed for workouts and other athletic activities are worn in other settings, such as at the workplace, at school, or at other casual or social occasions.

Athleisure outfits include yoga pants, tights, sneakers, leggings and shorts, that “look like athletic wear” and are characterized as “fashionable, dressed up sweats and exercise clothing.” The general concept can be summarized as “gym clothes making their way out of the gym and into everyday wardrobes.”

The idea has been covered extensively, including reporting done by NPR.

Athleisure Becomes Mainstream

NPR reported in 2015 that, “The NPD group says sales of athleisure apparel were more than $35 billion last year and that athletic apparel now makes up 17 percent of the entire American clothing market.

H&M, Urban Outfitters, Aeropostale and TopShop have all launched athleisure lines. Certain collections have gotten endorsements from celebrities like Kanye West and Beyonce. Chanel even makes a couture sneaker now.

How did all of this happen? Will McKitterick, an analyst with IBIS World, says there are two big factors at play in the rise of athleisure: yoga and the cyclical nature of blue jean sales.

First, McKitterick says, there has been what he calls “a change in what’s appropriate to wear.” Think yoga pants. Over the past decade or so, women have led this charge, specifically in their embrace of yoga pants outside of yoga studios. Now yoga pants, tights and leggings have moved from the gym to just about everywhere. That only helped make room for men’s sweatpants to leave the couch.

McKitterick says declining jean sales are part of the equation as well. Reports say sales of denim in the U.S. were down 6 percent last fiscal year. “Men, and people more generally, have a lot of jeans,” he says. “Jean sales have done really well over the last 10 years, and we’ve gone through a number of different fads surrounding jeans, perhaps most recently skinny jeans.

“But, fashion denim is cyclical,” says McKitterick. “So it seems we’re in a downturn period right now, and that’s not too surprising coming off the large amount of sales we’ve seen over the last 10 years.”

Athleisure apparel helps fill that void. For what it’s worth, McKitterick says jeans have faced competition before, from corduroys in the ’70s, and khakis and chinos in the ’90s. Jeans bounced back both times.”

Growth Offers Opportunities

Any new trend offers potential opportunities for investors. In the case of athleisure, the opportunities could be significant.

Morgan Stanley has predicted a growth to $83 billion by 2020, stealing the market share from non-athletic apparel. The graph below charts the rise of the trend globally, with sales climbing from $197 billion in 2007 to over $350 billion by 2020.

sales projection

Source: Forbes

Analysts with Deutsche Bank note that athletic clothing is hurting regular clothing’s sales.

“We see athletic apparel boosting the industry, up 4.1% from 2008-2015 on average,” the authors write. “Meanwhile, non-athletic apparel was up only 0.2% during that timeframe and lagged overall apparel in seven of the past eight years.

As we believe the athleisure cycle is a bona fide trend with further dollar share shift ahead, we expect the disparity between athletic and non-athletic growth to widen in upcoming years.”

Investors should consider buying industry leaders which include Lululemon Athletica (Nasdaq: LULU). Shares are already up sharply but some analysts see significant room for growth and expect short term gains in the stock.

LULU weekly chart

Brokerage firm William Blair named the stock among six with high potential for “appreciation over the next 60 days.” The call was part of a “Consumer Near-Term Focus List” it publishes every two months.

“We believe strong sales trends have continued in the second quarter driven by good execution and product newness, including expanded streetwear (tees, wraps, skirts, and joggers) and shibori dyed prints,” the analysts wrote.

They cited management’s suggesting strong same-store sales in Q2 and said they expected it to beat Wall Street’s consensus for quarterly comps while beating the consensus EPS estimate of $0.49. (The company guided investors toward $0.46-$0.48.)

“We believe investors will applaud the company’s healthy sales trends when second-quarter results are reported in late August/early September,” William Blair wrote.

“Longer term, we continue to believe Lululemon has an enviable competitive position with a powerful combination of highly productive small-format stores, aspirational proprietary product, a healthy e-commerce channel, and the potential to ultimately nearly triple revenue as the concept continues to expand across the globe,” the analysts wrote.

Analysts expect LULU to grow earnings at an average of about 16.7% in the next five years, putting it in the top 30% of growth estimates.

Bargain hunters might be attracted to Skechers (NYSE: SKX) which is also expected to grow earnings at about 16% a year.

Skechers is a designer and marketer of Skechers-branded lifestyle footwear for men, women and children, and performance footwear for men and women under the Skechers Performance brand name.

It also offers apparel, accessories, eyewear, scrubs and other merchandise. Its lifestyle brands include Skechers USA, Skechers Sport, and Skechers Active and Skechers Sport Active. The company’s products are available in over 170 countries and territories around the world.

SKX weekly chart

This chart shows a stock that is basing with clear support in the $23 to $25 range which should limit downside risk. SKX trades with a price to earnings ratio of just 16.5, well below the industry average of 25.3.

Whether you are comfortable with growth or value stocks, there are opportunities in the athleisure group. The biggest names on Wall Street expect the trend to last for several years and consumers are unlikely to abandon comfort. That makes these stocks potential winners in the long term.

You can find more market related tips and products by clicking here.

Value Investing

Insider Buying Highlights Bargains

ABBV stock

A recent study confirmed that parents should avoid saying things like “do as I say, not as I do” to children. The children learn from watching and the misbehavior of parents, even if the parents instruct kids to ignore it, sets a bad example.

Investors should learn from that study. As investors, we should assign more weight to what management teams do than to what they say.

If we listen to management on a quarterly conference call, the message is often upbeat. The company is generally on the right track and although there may be challenges, management is prepared for them and will do well in the long run.

Logically, that’s what we would expect management to say. We would sell the stock of a company if management said they were having problems but weren’t sure what the causes are and have no plan to overcome the challenges they face.

This means that we should focus more of our attention on what management does rather than what they say.

Management Shows More With Their Money Than Their Words

Managers have unique positions within a company. Their positions provide them with inside information, the kind of information that could benefit investors.

Insiders, like the company’s CEO and other C suite executives, know sales forecasts and results. They know about cost overruns or higher profit margins before the news is released. They have the information because it is their job to know more about the company than outsiders could know.

Because they are in such unique positions, there are rules about how they can trade the stock of their companies. In general, buying is allowed as long as it is disclosed. Selling is also allowed as long as it is disclosed. However, management cannot trade when they have information that could move the stock.

In other words, if management knows bad news is coming, they cannot sell ahead of the news. A recent example of this was in Equifax, the credit reporting company. The Securities and Exchange Commission (SEC) is reviewing sales of managers who sold before the company publicly announced a data breach.

This means that if managers know bad news is coming, they may not sell but they would almost certainly not be buying. It turns out buying could be the most significant action managers take in their companies.

It’s not generally a good idea to own an excessive amount of stock in the company you work for, from a personal financial planning perspective. The problem with this is that if the company does poorly, your job is at risk at the same time your investments are declining in value.

Insiders know this, so their buying shows a high degree of conviction in the future.

Following Insiders

Because of their unique positions, insiders are required to report all transactions to the SEC. This can be a lot of data to sort through and there is generally a lot of information that will not be helpful. For example, stock grants are not providing information that is helpful to individual investors.

A stock grant will be a form of compensation. The acquisitions that are more important are the ones where insiders place their own money at risk. Because this is subjective, the investor will need to consider various factors about the information.

An example of what could be considered important is below.

how to spot inside trades

Source: AAII.com

At times, this information can be useful but overall, insider buying should be just one factor that is considered. A screen based solely on this factor has underperformed the market in the long run.

insider net purchases

Source: AAII

This screen considers all purchases. Large purchases could be meaningful as a starting point for research.

A Recent Buy Highlights a Stock Pick

Barron’s recently reported that, “An AbbVie director has just made the largest insider stock purchase since the drug maker was spun off from Abbott Laboratories in January 2013.

Glenn F. Tilton, retired chairman and chief executive of UAL, a predecessor company to United Continental Holdings (ticker: UAL), paid $496,270 on June 27 for 5,400 AbbVie (ABBV) shares, about $91.90 each. That’s the largest open-market purchase of shares by an insider in terms of volume and dollar value. He now owns 39,735 shares.

Tilton is AbbVie’s lead independent director and has been on the board since 2013. He was reelected in May and his term now expires in 2021.

Tilton’s purchase is also his first as an AbbVie insider, making his transaction seem even more bullish.”

We don’t know what Tilton likes about ABBV. But, we know he is putting his own money into the company. He could believe in the growth of the company or he simply sees little risk at this point. All we know is he is making a large investment when he could use that money for any other investment.

This is a starting point for research. The chart could be the next step in the process.

ABBV weekly chart

The weekly chart above shows that ABBV is in a pullback after an extended rally. The stock is near support, and that support level is near the price the insider used as a buy point. In fact, the pullback seemed to offer the insider a desired entry point.

ABBV markets a variety of drugs focused on treating conditions, such as chronic autoimmune diseases in rheumatology, gastroenterology and dermatology; oncology, including blood cancers; virology, including hepatitis C virus (HCV) and human immunodeficiency virus (HIV).

The stock is trading with a price to earnings (P/E) ratio of about 15.6. This is a discount to the average industry average P/E ratio of 23.2 and is below the historic average P/E ratio of 23.8 that ABBV has traded at over the past five years.

Earnings per share are expected to grow at an average of approximately 17% a year over the next five years, an above average pace of growth. That implies the stock should trade with an above average P/E ratio.

Overall, ABBV appears to be undervalued. The 52-week low offers a nearby risk level and a new low could be a sell signal. The insider trading activity in this stock highlights what appears to be a low risk trading opportunity with a large potential reward.

Cryptocurrencies

Analyzing Bitcoin in Real Time

cryptocurrencies

Bitcoin and other cryptocurrencies are perfect for technical analysis. They are much like commodities markets where fundamentals play a smaller role than they do in stocks. In the stock market, earnings and cash flow are widely studied. That’s not true in other markets.

Commodity market fundamentals are relatively arcane and specialized. Because of that, much of the trading in these markets is based purely on technical analysis. Funds and commodity trading advisers (CTAs) control billions of dollars and some never consider fundamentals.

The same is largely true in the new crypto markets. There are fundamentals to consider. The fundamentals, as they do in all markets, consist of factors related to supply and demand. For cryptos the supply is often detailed in white papers that detail the rewards of mining and costs of use.

But, the white papers are highly technical. And, in the end, traders make buy and sell decisions based on price because that it is what they all understand. Because fundamentals represent just a small factor in the investment process, technical analysis is well suited to analyzing cryptos.

Starting With a Chart

Most technical analysts begin their review of a market with a look at the chart. There are multiple time frames and multiple formats that could be used. To begin with, we will assume that the trader is focusing on short term profits.

Short term traders will generally make decisions based on the intraday or the daily chart. The daily chart is probably the most practical choice for the individual trader who is often at work and unable to completely follow intraday market action.

To determine whether the daily chart is on a buy or sell signal, it can be useful to take a step back and look at the chart of a higher time frame. This would be a weekly chart since the trader is looking at buying and selling based on daily charts. The weekly chart is shown below.

Bitcoin futures chart

The chart includes a trend line. Drawing trend lines is generally a subjective exercise and there will always be multiple ways to do so. The important point in this chart is simply that the trend on the weekly chart is down.

However, the pace of the decline appears to be slowing. The bubble and the crash are clearly visible on the weekly chart. Generally, after a bubble, prices will fall to the level where the bubble began.

Determining precisely where a bubble began is also a subjective process which means that some degree of judgement will be required. The blue rectangle in the chart is a plausible point that could be cited as the starting point of the bubble. The green rectangle is an extension of that price zone.

Prices have fallen into the green rectangle on three occasions. The previous two prompted nearly immediate rebounds. Prices on the weekly chart are now at the lower end of that rectangle and a rebound appears to be likely.

This price level is also an obvious support level. The blue rectangle shows resistance at that level prior to the bubble forming and resistance is expected to become support after it is broken.

This all indicates, based on the weekly chart, that there is little down side risk in buying at that point. The trade is not risk free, but the weekly chart shows that a bottom is likely. It needs to be confirmed by the daily chart and by momentum.

Drilling Down On the Chart

With a bullish bias in the long term, based on the weekly chart, we now turn our attention to the daily chart which is shown next.

Bitcoin daily chart

Here, it is possible to see more detail. We see that the first test of support in February was abrupt. There is a spike low and a sharp reversal. This indicates that buyers appear to be looking for a buying opportunity at that time.

In April, when prices returned to the rectangle, buyers were more aggressive, and prices failed to reach the bottom of the rectangle. In this latest instance, the sellers were more aggressive, and a gap formed near the beginning of the rectangle.

This price action indicates that our analysis seems to be a consensus view with many traders following the market action seeing the same obvious patterns on the chart that we identified. The brief dip below the lower line indicates buyers are again the more aggressive traders in the market.

The daily chart confirms that this appears to be an area of support and buying should carry little risk at this level.

Checking Momentum

Finally, we want to check momentum. This should be done with the daily chart and in the chart below, we have added MACD to the same chart that was shown above.

Bitcoin momentum

Any popular momentum indicator could be used because they all tend to offer similar signals and the timing of the signals is usually within a few days of each other. In this case, MACD is turning bullish, shown as a cross above the zero line in the chart. The indicator is also rising, indicating we are likely at the beginning of a trend.

Overall, this tells us that bitcoin could be attractive to traders at this level. On a rally, bitcoin could move quickly to the upper end of the green rectangle which is the first resistance level. That offers a potential gain of about 15%.

The next resistance level after that is near $10,000. That is a level visible on the chart and it is likely to be a strong psychological test of the currency. A break above $10,000 could be followed by a sharp rally. Buying now provides the ability to endure some testing of that level, since traders would have a gain of more than 30% at that price.

Given the potential up side, the trade could be attractive to aggressive traders. A stop loss could be used to manage risk. Traders could simply sell on a reversal of the MACD. Or, since the initial target is for a gain of 15%, traders could risk half that amount, placing a stop about 8% below their entry.

Technicals say now is an excellent time to buy bitcoin, perhaps the lowest risk entry point since the bubble popped in December.


For other market related tips and products, Click Here.


Weekly Recap

Weekly Review

weekly review


Google, Facebook and Twitter Could Reverse Crypto Trend

The major internet companies are setting policies to limit misinformation. But, once again, unintended consequences are arising from policy decisions. Recent decisions related to cryptocurrency ads are being questioned.

This week, we discuss those decisions and explain why information is a powerful tool for crypto investors. You can learn more right here.

Is Value Investing an Art or a Science?

Doctors often describe medicine as part science and part art. What they mean by that is diagnosing a set of symptoms seems like something that is based in science. But, there is an art to the diagnosis. That’s because some cases are simply unique and sometimes, symptoms overlap.

This is true not just for medicine but also to a number of other professions, including value investing. Find out more right here.

Follow a Nobel Prize Winning Economist into This Sector

Let’s face it. Investing is hard work. Finance professors figured that out a long time ago. One, Harry Markowitz, realized investing could be so hard that few people will beat the market. He created a theory to explain what could be the best way to invest.

We share that with you in this article.

Evidence Trumps Fear for Income Investors

Fear is widely used as a selling strategy. Do you need an extended warranty with that new item you just purchased? Odds say you probably don’t. Despite the low risk, many consumers still purchase them.

Are you curious what this has to do with income investors? Find out here.

Passive Income

Evidence Trumps Fear for Income Investors

Fear is widely used as a selling strategy. Do you need an extended warranty with that new item you just purchased? Odds say you probably don’t. It is likely to break during the period covered by the manufacturer’s warranty or it is likely to just work as expected.

Probably, the item will simply work as expected. But, many consumers choose the extended warranty. They do that because they have at least a small amount of fear that the product will break.

Companies that sell these warranties know that most items will not break. That’s why they sell the warranties. They are most likely in the warranty business to make money rather than repairs. Despite the low risk, fear trumps evidence for many consumers.

Fear in the Fixed Income Market

For some time, investors have been concerned about a crash in the bond market. According to CNBC, “One of the top three worries for investors right now is a crash in global bond markets.

When asked what poses the biggest “tail risk,” or worry for the financial market, 22 percent of global investors considered the biggest risk to be a sharp drop in bonds, according to Bank of America Merrill Lynch’s November Global Fund Manager Survey out Tuesday.

That’s just below the 27 percent of respondents that fear mistake in monetary policy by the Federal Reserve or European Central Bank the most.”

The fear is both general, that a crash is going to occur, and specific in that at least some investors know exactly what the cause of the crash will be. As the Financial Times reported, “ETFs to play main role in the next crisis.”

As the respected source explained, “The next financial crisis will be played out in indexes and exchange traded funds. That is inevitable given the huge share that ETFs now take of investor fund flows, and their popularity as hedge fund trading vehicles.

What is less clear, and deeply controversial, is whether the structure of ETFs will itself contribute to the next crisis, or even cause it. Regulators, worried by past incidents when untested financial innovations helped exacerbate financial crises, are worried that it could.

ETF providers indignantly counter that they make the market more liquid, and less prone to sudden stops. Indeed, they complain that well-intentioned regulations exacerbate a problem they were meant to cure.

The scale of the ETF industry is not in question. They now hold more than $3tn in assets. But this raises the question of whether they have come to lead the market rather than follow it. This operates at two levels. First, there is a concern that the power of the indexes distorts markets over time, and second, there is the possibility that the structure of ETFs and index funds worsens market shocks when they happen.”

It Is a Logical Fear

This argument is simple to understand. It could be thought of like everyone trying to exit a crowded facility at one time. If there is only door, there is a backup created by everyone to squeeze through the exit at the same time.

Even in well planned facilities, such as stadiums, there is a backup created when everyone leaves at the conclusion of the event. If there is a panic towards the exit, there can be a tragedy and these have happened all around the world at different times.

Some believe the ETFs are like a crowded theater with just a couple of exits. If something happens to trigger a panic, there will be a rush for the exits and a crash in the market is the almost inevitable result.

This fear has grown as the size of the assets in fixed income ETFs grew. With more than $560 billion in assets, this is a significant market.

assets in billions

Source: Statista

The concern is greatest in the less liquid corners of the fixed income market. Treasury securities have deep liquidity but high yield, or junk, bonds are less liquid. Debt issued by emerging economies is another concern since ETFs represent a large portion of thin markets like this.

A Real World Test Dispels the Fear

The fear is certainly logical and analysts have known for some time that they would not understand how large redemptions would affect ETFs until after the fact. There needed to be a large redemption in order to prove or disprove the hypothesis. Recently, a test occurred.

On June 20, the Financial Times reported, “VanEck’s flagship $4.5 billion local-currency emerging markets bond ETF suffered a sudden sale of nearly 19 million shares worth $321 million in one giant block trade this morning, indicating that a single investor probably pulled the plug after a torrid time for the market.”

A chart of the days surrounding that transaction in VanEck Vectors JP Morgan Emerging Market Local Currency Bond ETF (NYSE EMLC) is shown below.

EMLC chart

Source: Standard & Poor’s

The Financial Times concluded, “the market absorbed the sale without a glitch — the VanEck ETF suffered a slight wobble around the sale but has actually climbed 0.2 per cent higher today — indicating that concerns over liquid ETFs buying less tradable securities such as local-currency EM debt could be overdone.”

The next chart shows details on the market capitalization of the ETF, the red line, and the number of shares outstanding, the green line.

EMLC chart

Source: Standard & Poor’s

This was a significant withdrawal from the fund. The decline in shares outstanding confirms that the fund did experience signal selling pressure. The drop in market cap confirms that. This is important to notice since it reveals the ETF did see about 6% of its assets redeemed in a single day without offsetting increases in assets from new investments.

This is just one market and one example. But, it does show that funds can handle redemptions without crashing. This example should give fixed income investors some degree of confidence in the market.

There could be a bear market in fixed income but it is more likely to be caused by higher interest rates than market structure problems associated with ETFs. That may be both reassuring and frightening to investors.

But, the lesson is that investors should focus on trends in interest rates and not be overly concerned with outside factors. That is good news.

Stock Picks

Follow a Nobel Prize Winning Economist into This Sector

reconstruction

Let’s face it. Investing is hard work. Finance professors figured that out a long time ago. One, Harry Markowitz, realized investing could be so hard that few people will beat the market. He created a theory to explain what could be the best way to invest.

Markowitz understood that risk and reward are strongly correlated. In order to achieve larger than average rewards an investor will need to accept larger than average risks. If an investor is uncomfortable with risk, they must accept low returns associated with low risk investments.

It’s a straightforward idea, well supported by extensive math. It’s an idea that won the Nobel Prize for economics in 1990. Markowitz’s theory of portfolio choice explains how investors can allocate investments to maximize their expected return based on the level of risk they are comfortable with.

It was Markowitz’s work that led to an understanding of the importance of diversification. He showed that owning uncorrelated assets could maximize returns consistent with risk. This is the well known efficient frontier.

efficient frontier

Source: Wikipedia

Markowitz Likes One Sector In Particular

According to a recent article in Barron’s, Markowitz “has invested 100% of his liquid assets in the stock market, betting that the destruction from last year’s hurricanes will bolster industries involved in the reconstruction.”

“It’s for the long run, but not the indefinite long run,” he says. “My thought process is this: They are someday going to rebuild Houston. It will take a while, but they’ll rebuild Houston. They’re going to rebuild Florida….And they’re going to rebuild Puerto Rico.”

Markowitz, in some ways, has a theory of the markets that is consistent with George Soros’ reflexivity approach. Both believe that there are actions and reactions to changes in market prices. These changes reflect fundamentals but do not rely solely on fundamentals. Prices create reactions of their own.

He sees an action and reaction sequence building in the wake of the hurricanes.

“My knowledge is inference and action,” he says. “I never did a study of the construction industry, but I know there’s walls there, and glass there, and if you want to get rid of rubble,” you will need the right equipment, he says.

At the age of 90, Markowitz is retired and has income from pensions and social security in addition to investments. He wanted 100% of his liquid assets to be in stocks and at first, he allocated one third to large cap stocks, one third to a small cap ETF and one third to an emerging markets ETF.

Markowitz

Source: NobelPrize.org

This seems aggressive for many investors, especially a 90 year old retiree. But, Markowitz explained,                                                        

“Then I said no, no, no, let’s take the one-third big cap and split it equally among six equities.”

His selections are companies he believes will benefit from rebuilding hurricane damaged areas:

  • Weyerhaeuser (NYSE: WY) because it will provide lumber that’s needed for reconstruction;
  • USG (NYSE: USG), a company that makes wallboards;
  • Corning (NYSE: GLW) which provides glass that will be used in windows;
  • Caterpillar (NYSE: CAT) which Markowitz explained by saying, “think of how many bulldozers they’re going to need all over Puerto Rico;”
  • 3M (NYSE: MMM) which is involved in mining; and
  • United Technologies (NYSE: UTX), a conglomerate with divisions that make air conditioners and Otis elevators.

UTX is typical of the stocks. Its chart is shown below.

UTX weekly stock chart

The stock has been a market leader but has sold off as talk of a trade war builds. Companies like UTX and the others that are on Markowitz’s list are vulnerable to a trade war.

These are companies that produce things in a global economy. They sell finished goods overseas and are subject to retaliatory tariffs that other countries impose on US goods. They also use imported goods in their manufacturing process which will cost more if tariffs are imposed by the US.

Markowitz’s Wisdom Extends to the Broad Market

In addition, his current portfolio allocation with Barron’s, Markowitz shared several anecdotes that reveal his wit and his wisdom. In short, he provided advice that all investors should consider.

First, he urged investors to understand their abilities and limitations. He reminds us that we are not Warren Buffett, and admits that he isn’t either.

 “Whether you’re passive or active, in general, as a basic principle, depends on how much information you have. Now, Warren Buffett and David Swensen, CIO of Yale University, they get offers that I don’t get and I bet you don’t get.

They get information I don’t have, and they have staff which they have personally trained that can evaluate that information. I am passive, since I’ve got more money than I need.”

This means we should invest only when we are confident we have enough information to do so.

Next, he addressed whether the current stock market is priced too high to invest in. He doesn’t think so.

“I’m just looking at the statistics of the stock market—they are not looking one step beyond how the economy is doing or what the economy is likely to do. The economy is likely to rebuild Puerto Rico!

We suddenly have a big influx of capital and an incentive to spend it, and we have an increase in supply and an increase in demand. But we are going to have economic activity at least until Puerto Rico is rebuilt, at which time I might be dead.”

Finally, he discussed a conversation he had with a new client and how he we will know when the stock market is too rich.

Like many of us, the client asked, “How would we know when the markets were ready to turn south?”

Markowitz responded by asking if the multibillion dollar fund manager was familiar with the Road Runner cartoons.

“You know how Wile E. Coyote chases Road Runner off the cliff and then finds himself hanging in space momentarily defying gravity before plummeting into the abyss,” Markowitz said.

For now, we are still running towards the cliff, Markowitz concludes. That means we should consider adopting his allocation towards aggressive positions and investors could seriously consider his construction thesis for new investments.


Value Investing

Is Value Investing an Art or a Science?

value investing

Doctors often describe medicine as part science and part art. What they mean by that is diagnosing a set of symptoms seems like something that is based in science. But, there is an art to the diagnosis. That’s because some cases are simply unique and sometimes, symptoms overlap.

When symptoms overlap, a fever for example, the symptom could point to multiple factors. Running through a checklist to identify additional symptoms could narrow the possibilities of diagnosis but that could be timely and there will be times when time is short.

Since there can be so many possibilities for some patients, experience can be useful. This is where the art comes in. The diagnosis will still be grounded in science, but the practitioner will have developed knowledge which helps them act faster and more accurately at times.

The same will apply to treatment options which require a combination of science, experience and art. This is true not just for medicine but also to a number of other professions.

Value Investing as Science

Value investors often believe they are dealing with a precise process. For example, they might use a simple formula for finding the fair value of a stock such as the discounted cash flow (DCF) model.

DCF model

Source: CFA Institute

As an alternative to the DCF model, analysts may choose to use a number of other models. A market multiple model may be more popular among individual investors than the DCF model which may be used by professionals.

As an aside, a recent survey found that more professional investment analysts use a market multiple approach than a DCF model. In the survey of 1,980 market pros, 68.6% reported using the multiples model at some point while 59.5% used a DCF approach. Professionals often use multiple approaches in their work.

Market multiples are tools to determine the price of an asset relative to the price of comparable asset. So, they establish a ranking of asset values. For example, they tell us which one of a group of stocks is the most overvalued and which is the most undervalued.

There are a variety of multiples available. For example, there is the price to earnings (P/E) ratio. The P/E ratio compares the stock’s current price (P) to its earnings per share (E). Earnings could be the historical earnings, projected earnings, average earnings over some number of years or adjusted earnings.

Other popular multiples include the dividend yield, the price to book (P/B) ratio, price to sales (P/S) ratio, the price to cash flow (P/CF) ratio and various ratios based on enterprise value (EV).

The P/E ratio may be the most popular multiple among individual investors and it is also the most popular among market pros.

valuation

Source: CFA Institute

There are other approaches that are used by professionals and individuals. All of these approaches rely on data and formula, but none will ever be 100% reliable. That explains, in part, why there are so many different approaches and why there is no guarantee of success.

Value Investing as Art

One of the greatest value investors of all time is Warren Buffett, an individual who has created billions of dollars of wealth with the principles of value investing. He describes his approach in relatively simple terms.

Buffett reads annual reports and develops a value of what he believes the owner’s earnings should be. This can be roughly approximated as earnings before interest, taxes, depreciation and amortization with required capital expenditures added back in.

After finding adjusted earnings, Buffett then discounts those earnings to find the net present value of the projected earnings. He has written that he uses the interest rate on the ten year Treasury note as his discount rate.

Now, even after Buffett explains all that, we know that no one else seems to be able to do that. While Buffett describes his process in terms that sound scientific, there is clearly and art to what he does. If there was not, then others would be able to duplicate his process.

Can Value Investors Beat the Market

Acknowledging there is not an art and a science to valuation methods, the question is whether or not investors can beat the market. The answer is “it depends.”

There are certainly many individuals trying to beat the market.

The number of investors is growing. Graham and Dodd wrote their seminal book Security Analysis: Principles and Techniques in 1934. Some 20 years later, roughly 4% of the US population owned stocks.

Another 40 years later, that figure had grown fivefold: 20% of the US population owned stocks (including stock mutual funds), thanks largely to the introduction of individual retirement accounts (1974) and the first index funds (1976).

There is certainly ample opportunity to beat the market.

The investable universe was still largely domestic and small: 2,670 listed firms in the United States in 1975, according to the World Bank. According to the same database, only 1,398 firms were listed in Japan in 1975, 471 in Germany, and none in either China or India.

By 2016, the number of listed firms worldwide had exploded to 43,192, of which only  4,331, or 10%, were in the United States; China (3,052) and India (5,820) together accounted for 20% of all listed firms worldwide. The number of listed firms for Germany in 2016 was 555 and for Japan 3,504.

Investors looking for returns have many more options than they ever did in the past. But, the role of the investor needs to adapt in this environment.

To beat the market, it is important to focus on what matters the most. Despite all of the distracting information available, earnings matter.

cumulative return

Source: CFA Institute

In the long run, earnings matter. This has become especially important as access to information has expanded. Companies with negative earnings have underperformed in this century. Simply looking for earnings, now or in the near term, could boost investment returns.

Now, the art comes in deciding which earnings to use. Like Buffett, it could be useful to adjust earnings, a skill that will take time to learn and apply.

For other market related tips, Click Here.


Cryptocurrencies

Google, Facebook and Twitter Could Reverse Crypto Trend

news

Fake news! Election meddling! Social media warriors!

There are a lot of negatives associated with social media and the online giants. Much of it is unintended. Facebook, for example, once connected friends, helping acquaintances from high school, for example, reunite.

Google became the source of information for many individuals. Google’s placement of news stories could make or break a news site. The same is true for Facebook. And, Twitter can help a story get distribution and become more popular than was possible years ago.

But, the companies came under attack for their reach in recent months. Question arose about the impact the companies had on the 2016 Presidential election and in more recent weeks, their role in distributing information on Brexit have come under scrutiny.

In response, the major internet companies are setting policies to limit misinformation. But, once again, unintended consequences are arising from policy decisions.

advertising policies

Source: Google

Crypto Becomes Taboo

Recent decisions related to cryptocurrency ads are being questioned. According to CoinTelegraph.com, “Businesses and investors alike went on record this week to pan Google for its cryptocurrency advertisement ban which began June 1″, The Independent reports Monday, June 4.

As a correction gets underway, Google has come under fire in increasingly explicit terms for its decision to block cryptocurrency ad content while it pursues blockchain technology.

“I understand that Facebook and Google are under a lot of pressure to regulate what their users are reading, but they are still advertising gambling websites and other unethical practices,” Phillip Nunn, CEO of UK investment firm Blackmore Group with £70 mln under management, said to The Independent Monday.

Both Facebook and Twitter have moved to implement similar bans this year, despite the latter’s CEO forecasting that Bitcoin would become a “single world currency” as soon as 2028.

Suspecting a targeted move, Nunn suggested that like Facebook, Google was moving to prepare the way for its own, centralized virtual asset.

“I suspect the ban has been implemented to fit in with potential plans to introduce their own cryptocurrency to the market in the near future and therefore removing other crypto adverts allows them to do it on their own terms,” he added.

Meanwhile, UK disruptor bank Revolut, which in April completed a $250 mln funding round to achieve a $1.7 bln valuation, warned the policy failed to distinguish legitimate companies from bad actors.

“Unfortunately, the fact that this ban is a blanket ban will mean that legitimate cryptocurrency businesses which provide valuable services to users will be unfairly caught in the crossfire,” head of mobile at digital banking Ed Cooper commented.”

There could be repercussions for the markets. Price activity could rise and fall based on the policies of the internet gatekeepers. Although there are certainly other reasons, the price of bitcoin is in a down trend and the Google policy could be one factor.

BTC-055 daily stock chart

Investors Could Suffer

The ban is absolute, so far, and affects companies that are trying to scam consumers in addition to companies that are legitimately trying to provide useful information. Markets are information dependent, so these policies could affect markets, and could hurt investors in addition to helping some.

Because of its sweeping nature and possible impacts on the markets, this policy has been questioned. And, Techcrunch notes it could be changed. The web site noted it could be a business decision, beginning with a degree of skepticism:

“As there’s clearly too much ad revenue potential to ignore, Facebook today announced it is reversing its cryptocurrency ad ban effective immediately. The decision comes with a few caveats, however. The company says it will allow ads and related content from “pre-approved advisers,” but will still not allow ads promoting binary options and initial coin offerings.”

The story reviewed the rationale for the ban:

“Facebook had first enacted the ban in January, saying at the time that too many companies in this space were “not currently operating in good faith.”

While it admitted that banning all crypto advertising was a broad change, the company said that its new policy would “improve the integrity and security of our ads, and to make it harder for scammers to profit from a presence on Facebook.”

But it had also said the policy would be revisited over time, as its ability to protect deceptive ads improved.”

There will be some safeguards in an effort to protect consumers.

“This time around, it’s making advertisers go through an application process to determine their eligibility.

Facebook will ask advertisers to include on their applications details like what licenses they’ve obtained, whether they’re a publicly traded company, and other relevant background information regarding their business.

How thoroughly this information is fact-checked by Facebook staff remains unclear.”

Of course, there will be some scams in any market. The Securities and Exchange Commission (SEC) still shuts down Ponzi schemes and prosecutes securities fraud with some regularity.

U.S. Securities & Exchange Commission

Source: SEC

Techcrunch notes, “The crypto industry is rife with scams, so it makes sense that these major platforms would need some rules around what’s allowed. According to the FTC, consumers lost $532 million to cryptocurrency-related scams in the first two months of 2018, Coindesk reported on Monday. And an agency official warned that consumers will lose more than $3 billion by the end of the year.”

But, banning information, even in the form of ads, may not be the most effective way to deter fraud. Information could be the consumer’s most powerful weapon and if an investor decides to trade crypto, they should get as much information as possible.


For more market related information, Click Here.

Weekly Recap

Weekly Review

Central Banks Could Boost Crypto

There is a debate between skeptics and advocates of cryptocurrencies, or cryptos. Skeptics view the technology as a novelty at best while advocates see a change to the global financial system. We are in the early stages of the debate, but central banks are starting to find potential value in cryptos.

We explain more about the potential value and how it could boost crypto, right here.

Improving Value Investing

Hundreds of years ago, in medieval legend, medieval knights went on great quests in search of the Holy Grail. At least according to legends. Those legends gave rise to a phrase often used to describe a noble but difficult pursuit of something.

Investors have long sought the Holy Grail of investing. This week, we shared details that could lead investors down the right path. You can read more here.

How to Trade Oil Prices, Whether They Rise or Fall

Oil prices are a constant concern. Consumers worry about higher prices because gas and transportation expenses rise with oil prices. For most consumers, transportation expenses are unavoidable so higher gas prices can reduce the money available for discretionary spending.

For traders, higher prices present an opportunity and a risk. We discuss both in this article. We also provide stock picks that can be profitable whether oil prices rise or fall.

Climbing the Ladder to Escape Inflation

Interest rates are rising, slowly. Federal Reserve policies seem to be pointing to even higher rates. And, after a decade of historic low rates the increases are welcome by income investors. But, the increases raise an important question for many income investors.

Income investors are faced with a dilemma that is easy to understand. Should you invest now or later? Find out here.