Passive Income

Experts Say These Are the Best Income Investments

stock exchange

Sometimes, we all need expert advice. This is obvious, but we don’t always want to accept it. Investors may find that they can succeed in the stock market without expert advice.

That’s largely because the same information is available to all investors. In stocks, there is a level playing field to some degree, at least as far as access to information is concerned. Professionals will have some advantages as far as speed of access to information and speed of execution of trades.

But, in some other investment areas, the playing field isn’t as level. This is particularly true for income investments. Real estate, for example, is one market where experts might have access to more capital and can make better deals than many individuals.

Fixed income markets are another area where experts might have an edge related to access to capital and access to information. That means in this market it could be useful to check in with the experts from time to time.

Experts Agree That Rates Will Create Challenges

One area of agreement exists on the topic of interest rates. Rates are low.

10 year treasury rate

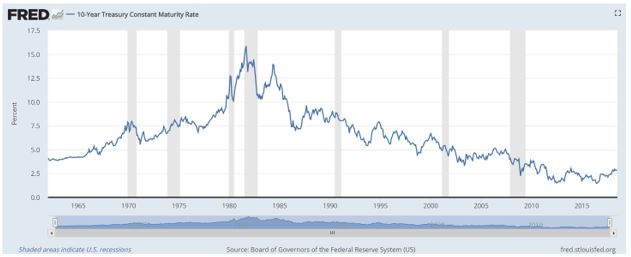
Source: Federal Reserve

Those low rates present several potential challenges for fixed income investors.

There is widespread agreement that low rates result in low income. That means access to capital and information can be important. Individuals might be forced to accept low yields while experts might be able to structure investments that can boost their yields.

But, risks exist even with simple strategies. For example, one advisor recently told Barron’s:

“The bond math is more forgiving for low-duration funds. With short-term rates at 2%, and likely to average 2.25% through the rest of the year, investors could generate a total return of 1.25% in short-term funds if rates were to rise by a point, says Chris Zaccarelli, chief investment officer of Independent Advisor Alliance, a network of advisors with $3 billion under management.

Zaccarelli has cut his clients’ portfolio duration from seven or eight years to three to four years to protect against rate risk. “Owning bonds is a no-brainer,” he says, “but we’re doing it in a way where there’s less of a headwind from rates.””

Duration is a measure of interest-rate sensitivity; the higher a bond’s duration (measured in years), the more its price will fall as rates rise. For example, in a fund or bond with a duration of six years, investors would lose 6% in principal if rates were to rise by one percentage point.

So, although investors would welcome higher interest rates on one hand, they will suffer losses on their existing investments as rates rise.

The Best Investments, According to Experts

Many investors have moved beyond mutual funds, so to speak. They have increasingly turned to exchange traded funds (ETFs) because of the advantages of ETFs which include liquidity and low fees. However, mutual funds can still be useful to meet investor’s objectives.

One short-term fund that Zaccarelli, the investment manager cited by Barron’s, likes is Thompson Bond (ticker: THOPX), an investment-grade fund with a duration of 1.1 years and a 3.4% yield.

Zaccarelli also noted that Semper Short Duration (ticker: SEMRX), an ultrashort fund, yields 2% and has returned 1.1% this year. With a duration of three months, it has held up well, beating 93% of peers, according to Morningstar.

Other specific investment recommendations are summarized in the table below.
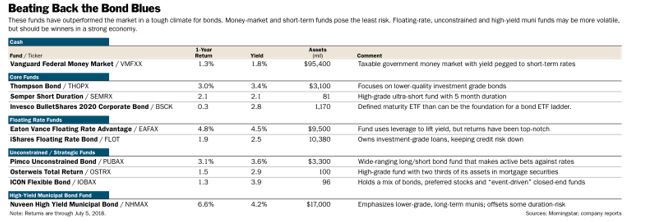
beating back the bond blues

Source: Barron’s

The list includes floating rate bank loan funds. As a group, these funds have gained an average of 1% this year, “one of the few parts of the market to stay in positive territory. The loans are short-term senior secured debt with coupons that adjust at regular intervals, based on prevailing short-term rates.

Much of the floating-rate market consists of junk-rated issuers. But the debt is typically secured by assets (unlike unsecured high-yield bonds). Default rates are low and probably won’t increase for another 12 to 18 months, preceding the next recession, says O’Neil.

Eaton Vance Floating Rate Advantage (ticker: EAFAX), a top performer, is up 2.5% this year. The fund uses leverage, or borrowed money, to juice its yield, heightening risk.

But it’s run by a veteran group of analysts and managers who have delivered top-notch returns, landing in the top 1% of the category over the past decade, according to Morningstar.

 Among ETFs, iShares Floating Rate Bond (FLOT) focuses on higher quality, investment-grade notes, reducing credit risk (in exchange for a lower yield).”

Another Potential Solution to the Low Yield Conundrum

Experts agree that bond ladders are a good way to create a predictable income stream from bonds (or exchange-traded funds) that mature at different intervals. This is a strategy that adapts to changes in the interest rates by allocating part of the portfolio to different maturities.

Over time, bond ladders help reduce risks. Other advantages include the fact that ladders are flexible and allow investors to take as much interest rate and credit risk as they wish, instead of leaving those decisions to a fund manager.

A bond ladder also allows investors to rapidly adjust the portfolio themselves if their income needs change or rates make a big move. Although ladders could consist of individual bonds or Treasuries, they could also be built with ETFs.

For example, analysts note that investors could place 25% in the Invesco BulletShares 2020 Corporate Bond ETF (NYSE: BSCK) and add 25% each to three more BulletShares ETFs maturing in 2021, 2022, and 2023.

This would provide the investor with a high quality, short term portfolio with a current yield of about 3.3% yield and a duration of about three years. Remember that duration describes the risk of loss so in this case, a 1% increase in interest rates should be expected to result in a 3% loss of principal.

With the bond ladder outlined above, when each ETF matures, investors could reinvest the capital, taking advantage of higher yields if market rates continue to rise. Other ETFs are also available that allow an investor to build a similar portfolio or a portfolio that meets their needs.

Fixed income investors might need to think creatively, and consider expert advice, given the current low interest rate environment and the risk that yields will rise.

Stock Picks

Research Proves It’s Easy to Beat the Stock Market

research paper

For many years, investors have often been told that it’s impossible to beat the stock market. This is the reason some investors choose index funds. That’s basically accepting the argument that “you can’t beat them” so it’s best not to try.

This argument is well supported by research according to many arguments. But, now new research provides a counter argument. In fact, the recent paper’s title is “It Has Been Very Easy to Beat the S&P 500 in 2000-2018: Several Examples” concisely summarizes the argument.

A Research Paper Grounded in Realistic Assumptions

Over the years, there have actually been a number of studies that show it is possible for investors to beat the broad stock market. These studies identified various factors, such as momentum, value, earnings quality and a host of others.

These studies were also unlikely to be reproducible by individual investors. To implement the strategy, the researchers assumed an investor would own a large number of stocks and simultaneously sell short a large number of stocks. Typically, 20% of publicly traded stocks would be in the portfolio.

Obviously, it would require significant capital to own so many stocks and selling short may not always be practical even if an investor has sufficient capital to short 10% of the stocks in the market. It’s simply not always possible to borrow shares to open a short position.

Those studies did offer investors hope that they could beat the market and many mutual funds and exchange traded funds were developed to provide exposure to specific market factors. However, factors move in and out of fashion, so to speak, and tend to work at different times.

This means that trying to invest by employing different factors can require research and effort that individual investors may find time consuming. Now, a study shows that there is what the authors call a “very easy” way to beat the market.

Perhaps the best part of the author’s research is the fact that investing with this very easy way is actually simple and straightforward and within reach of almost investor with a brokerage account.

The Details on the Very Easy Way to Beat the Market

In this study, the authors looked at the major market indexes in a different way. Indexes maintained by Standard & Poor’s are weighted. In a weighted index, each stock is held in a percentage determined by a formula. In the case of the S&P 500 the formula uses a float adjusted market capitalization.

This is different than an unweighted index where each stock is assigned the same weight. For example, in an equal weighted index of 100 stocks, each stock would be 1% of the portfolio. In this study, the authors compared the performance of the equal weighted index to the actual index.

The results showed a promising way to beat the market, “We document that unweighted indexes have outperformed weighted indexes and that the S&P 400 and the S&P 600 have outperformed the S&P 500. $100 invested in the S&P 500 in January 2000 became $252.6 in April 2018.”

This is shown in the chart below for the S&P 500 over the past ten years.

S&P 500 over 10 years

Source: It Has Been Very Easy to Beat the S&P500 in 2000-2018

The authors found similar performance for other indexes, noting, “but [$100] invested in the S&P 600 became $577.2, invested in the 30% smallest companies (equal weight) of Kenneth French became $617.9 and invested in the portfolio of [smallest companies and highest Book to Market] (equal weight) of Kenneth French became $1,640.

Then, we can conclude that it has been very easy to beat the S&P 500. Kenneth French data show (exhibits 5 and 6) that it has been so since 1927.”

Book-To-Market High and Small Size chart

Source: It Has Been Very Easy to Beat the S&P500 in 2000-2018

This chart uses a data set maintained by Dr. Kenneth French who developed a formula to explain the contribution different factors make to market performance. French completed much of his work with Nobel prize winning economist Dr. Eugene Fama.

French and Fama identified the value factor which is shown in the chart above. They identified value with the academic version of the price to book (P/B) ratio. They use the inverse, the book to market ratio, but the conclusion is the same. Value beats growth with this metric.

Subsequent research has shown that almost any valuation metric such as the price to earnings (P/E) ratio or dividend yields can work. But, value can fall out of favor for extended periods of time as the chart above shows.

This Research Relied on Rational Assumptions

This recent paper presented data that can be duplicated by the average investor.  The authors addressed this, explaining:

“When a rational investor invests for the long term, he cares about how much money he will have at the end (retirement, endowment…) and he diversifies to avoid a concentration of risk in some of the individual investments.

The rational investors (at least the ones we know) do not care about using “the best model”, “the most popular model”…They do not care neither about maximizing some ratio (Sharpe…) nor about minimizing the volatility of his portfolio (most rational investors we know like volatility: volatility does not measure the risk they want to avoid).”

So, they took a different approach:

The objectives of this paper are neither number crunching, neither to maximize anything nor to provide recipes on how to invest, but to provide with some data (facts) that help the reader to analyze his investments and, perhaps, to change his investment criteria.”

Now, all of this can be duplicated by individual investors. There are ETFs available to duplicate the equal weighted indexes the authors showed beat the market. The chart below compares the Rydex S&P Equal Weight ETF (NYSE: RSP) to the SPDR S&P 500 ETF (NYSE: SPY) since the bear market began in 2008.

RSP vs SPY

RSP lost less than SPY in the bear market and then delivered more gains throughout most of the subsequent bull market. Now, the returns of the two are in line but over the long run, RSP could be the better investment and offers a “very easy” way to beat the market according to research.


For other market related tips and products, click here.

Value Investing

The Truth About Warren Buffett’s Performance

Warren Buffett

Widely regarded as one of the greatest investors of all time, if not the greatest investor of all time, Warren Buffett is rightfully studied. The reason to study Buffett is to find clues about how he has delivered such extraordinary results. But, the answers have been elusive until now.

Studying greatness is a popular pursuit. But, the purpose of the study has not always been to emulate the success of the individual. For example, many have studied George Washington. The goal is not to become a president necessarily but to understand the leadership and civility which marked his career.

In the case of Buffett, the pursuit seems to be aimed at understanding how to invest like Buffett with the hope of duplicating his success. The truth is it will not be possible to fully duplicate his success.

In part, his success derives from his access to low cost capital and his reputation, factors that will be impossible for an individual investor to duplicate. But, there are still lessons to be learned from Buffett and there are important steps to take that can help improve an investor’s performance.

Buffett’s Performance: By the Numbers

One recent paper summarized important aspects of Buffett’s performance. “A dollar invested in Berkshire Hathaway in October 1976 (when our data sample starts) would have been worth more than $3,685 in March 2017 (when our data sample ends).” Of course, that needs context.

The authors provided that, “Over this time period, Berkshire realized an average annual return of 18.6% in excess of the T-Bill rate, significantly outperforming the general stock market’s average excess return of 7.5%.”

But, we know that high rewards generally come with higher than average risks so it is important to consider the risk of an investment with Buffett. “Berkshire stock also entailed more risk, realized a volatility of 23.5%, higher than the market volatility of 15.3%.” And, again, context is needed.

“However, Berkshire’s excess return was high even relative to its risk, earning a Sharpe ratio of 18.6%/23.5% = 0.79, 1.6 times higher than the market’s Sharpe ratio of 0.49.”

The Sharpe ratio is defined by Investopedia as “the average return earned in excess of the risk-free rate per unit of volatility or total risk. Subtracting the risk-free rate from the mean return, the performance associated with risk-taking activities can be isolated.

One intuition of this calculation is that a portfolio engaging in “zero risk” investment, such as the purchase of U.S. Treasury bills (for which the expected return is the risk-free rate), has a Sharpe ratio of exactly zero.

Generally, the greater the value of the Sharpe ratio, the more attractive the risk-adjusted return.”

Clearly, an investment in Berkshire Hathaway has been more attractive than an investment in the broad stock market. But, there are other ways to measure performance. Beta, for example, compares the volatility of an investment to the volatility of the broad market.

“Berkshire realized a market beta of only 0.69…[and] adjusting Berkshire’s performance for market exposure, we compute its Information ratio to be 0.64.”

The beta of 0.69 indicates that Berkshire Hathaway has had just 69% of the volatility of the broad market. This is generally a positive factor since volatility can cause investors to panic and sell at times when the investment isn’t performing well.

The information ratio is a measure of the risk-adjusted return of a financial security (or asset or portfolio). It is defined as expected active return divided by tracking error, where active return is the difference between the return of the security and the return of a selected benchmark index, and tracking error is the standard deviation of the active return.

It’s a more complex measure of risk adjusted performance than the Sharpe ratio and to understand it, we could use some context. The chart below shows Buffett’s information ratio compared to all funds with a track record of at least 40 years.

information ratio

Source: Buffett’s Alpha

What Explains the Performance?

So far, the research has conformed that Buffett is unusually good at investing. The authors also used statistical techniques to search for an explanation of why Buffett has been so successful. These techniques look at various factors and isolate the important components of return.

Not surprisingly, they find that Buffett buys low beta (less volatile stocks) that are high quality stocks. Now, the quality of the company is defined in a specific way.

To define quality stocks, the authors used four broad characteristics that are indicative of safer companies which define the quality to junk factor:

  • Profitability: Measured by such metrics as return on equity, return on assets, margins and cash flows
  • Growth: Measured by the prior five-year growth in the profitability measures.
  • Safety: Measured by both market beta and volatility, as well as by fundamental-based measures such as leverage, volatility of profitability, and credit risk
  • Payout: Management’s agency problems are diminished if free cash flows are reduced through higher net payouts (including dividends and buybacks offset by new share issuance).

Using these tools, the authors found a portfolio could even outperform Buffett.

Now, an investor could buy and hold the same companies Buffett owns but that will not beat Berkshire Hathaway. The chart below shows the companies in his portfolio do beat the market, but not as much as a portfolio of the stocks that pass the quality to junk and low beta tests.

Berkshire Hathaway and Buffett-Style portfolio

Source: Buffett’s Alpha

To truly duplicate Buffett, an investor would need to use leverage. The authors estimate that Buffett’s leverage is about 1.7-to-1 on average. And, his leverage is less expensive than anyone else would pay at least in part because of his reputation.

The next chart shows that Buffett is able to borrow money and access funds at an extraordinarily low cost.

Buffett's low cost borrowing

Source: Buffett’s Alpha

That is a portion of the performance that individuals cannot duplicate. But, individuals can buy good companies that have below average volatility (or beta) and approximate Buffett’s style. They don’t need to find the best tech stock or small caps since Buffett has shown large cap stocks can work well.

An investor could obtain leverage with margin but the cost will be greater than Buffett’s cost of funds. However, if the investor is truly focused on the long run, that is a risk that could be worth considering. Although margin is often frowned upon, the results show that leverage can boost returns.

That assumes the leverage is moderate. Excessive leverage, even with a value approach can lead to large risks. But, returns like Buffett will require accepting some risks.


Cryptocurrencies

Three Reasons Crypto Are Set to Soar

cryptocurrency

Cryptocurrencies have both proponents and skeptics. The skeptics raise some valid points. One is that transactions take a significant amount of time to process. Another is that government regulations could harm the market. A third is a lack of liquidity. All three are being addressed.

Mastercard Could Address Processing Time

Let’s start with the first, the time to process transactions. Mastercard was recently awarded a U.S. patent for a method of speeding up cryptocurrency payments. The company explains the problem in the patent application:

“It often takes a significant amount of time, around ten minutes, for a blockchain-based transaction to be processed … Conversely, traditional fiat payment transactions that are processed using payment networks often have processing times that are measured in nanoseconds…

Therefore, many entities, particularly merchants, retailers, service providers, and other purveyors of goods and services, may be wary of accepting blockchain currency for products and participating in blockchain transactions.”

The solution would be to offer a service similar to the process used to service other credit card transactions.

transactions

Source: USPTO

One analyst explained, “To reduce these transaction times, the company would be offering a new type of user account able to transact in cryptocurrencies through existing systems for fiat currencies. This account would link a series of profiles able to identify a user’s “fiat currency amount, a blockchain currency amount, an account identifier and an address.”

The transactions themselves would use the fiat currency’s payment rails and security features, but each transaction would represent a cryptocurrency.”

That could address one of the skeptic’s concerns. Regulation is still a concern but the path of regulation could be shifting.

India Is Considering Lighter Regulations

India has long been wary of crypto. The Reserve Bank of India (RBI) first warned investors of the risk involved in the market in late 2013. The risks are those that investors in the market should and many do, understand including volatility, security and possible links to illegal activities.

Reserve Bank of India

The warnings did express an opinion, but they failed to clarify the legal status of Bitcoin and cryptocurrencies in the country.

India’s Ministry of Finance compared Bitcoin to a Ponzi scheme and local banks, including State Bank of India (SBI), Axis Bank, HDFC Bank, ICICI Bank and Yes Bank, began taking strong action against crypto exchanges by either closing their accounts altogether or significantly curtailing operation.

In April 2017, the RBI announced that the bank would no longer provide services to any person or business that deals with cryptocurrencies, and that decision essentially became law on July 5, when the deadline expired.

That means that Indian citizens are currently not able to buy and sell cryptocurrencies on exchanges. Instead, they need to use peer-to-peer networks, where mainly crypto-to-crypto operations are allowed.

If an Indian citizen wants to exchange crypto to fiat, then they will need to turn to marketplace exchanges or the black market, the Times of India explains. Additionally, crypto exchanges and companies cannot receive loans from banks in India, according to the legislative.

In July, the Supreme Court of India will hold a hearing regarding the state of cryptocurrencies in the country. According to experts,

“It is a decisive date for the local crypto industry that has been significantly suppressed in the past month by the Reserve Bank of India’s (RBI) ban on all banks’ dealings with crypto-related businesses.

The hope for an overview of the hardline approach lives on, however, as last week a report citing anonymous sources in the government suggested that cryptocurrencies might be viewed as commodities in the future, and hence become regulated by relevant authorities rather than remain mostly banned.”

Despite the lack of clarity in the market, India’s Income Tax has been aggressive and has reportedly sent tax notices to as many as 400,000-500,000 investors, based on their transaction history.

Now, the Supreme Court of India is set to review the status, in a move that could be positive for investors and could signal a shift in the regulatory scheme of the currency.

BlackRock Is a Potential Liquidity Provider

Another concern is that liquidity is low in the markets because of a lack of institutional investors. In the equity and fixed income markets, large investors often provide liquidity for general trading and they are often buyers in times of crisis.

In other words, large investors stabilize the equity and fixed income markets. For now, there is not a similar market participant in the crypto market. But, that could be changing.

There are reports that the asset management giant BlackRock has set up a working group to look into cryptocurrencies and blockchain, the technology that is at the heart of the cryptocurrency revolution. BlackRock is one of the largest investment managers in the world.

Blackrocks's Growth

Source: Company Data

According to CNBC, “BlackRock CEO Larry Fink later confirmed the report in an interview with Reuters. “We are a big student of blockchain,” Fink said. He added, however, he does not see “huge demand for cryptocurrencies.”

In an earlier interview with Bloomberg, Fink said: “I don’t believe any client has sought out crypto exposure.”

Fink has previously railed against bitcoin, calling it an “index of money laundering.”

The working group is not a new development and has, in fact, existed since 2015, a source familiar with the matter told CNBC.

The news follows a report by Fortune magazine that hedge-fund billionaire Steve Cohen’s venture arm Cohen Private Ventures invested in Autonomous Partners, a cryptocurrency-focused investment fund.

Many industry experts believe that increased involvement from institutional investors in the cryptocurrency space will boost confidence in an otherwise dubious market.

“It definitely is causing some excitement,” Mati Greenspan, senior market analyst at eToro, said of the report on Monday. “The idea of big financial firms moving into crypto certainly isn’t new, and this is a trend we’ve been noticing gaining strength since November.”

These developments are all potentially bullish for the crypto markets and they are all a sign that the markets are preparing for another bullish run. If one of the three events listed here comes to pass, it could deliver significant gains. All three could push bitcoin and other cryptos to new highs.


Weekly Recap

Weekly Review

weekly review

This Step Could Save You from Cryptocurrency Scams

Scams are a part of any investment market. Within the past few weeks, the Securities and Exchange Commission (SEC) took action against an investment advisor that “engaged in a fraudulent trade allocation scheme, or “cherry-picking,” that harmed their advisory clients.”

With any investment, caution flags should always be investigated. In this article, we discuss those caution flags and explain how investors can protect themselves from crypto scams. You can read more right here.

Stocks Are Overvalued: Here’s What That Really Means

Value investing is simple in theory. The general idea is to buy stocks that are undervalued. They are held and eventually sold when they become overvalued. That is certainly a simple theory. But, the implementation of that simple theory can be a problem.

In this article, we discuss those challenges and provide tools that investors can use to overcome them. To learn more, you can follow this link.

This Sector Appears to Be on the Path to Recovery

Traders can find value in a top down investing style. This methodology, as its name implies, starts at the top and drills down.

This week, we used a top down investing style to identify potential trades. You can find those here.

How Real Estate Crowdfunding Can Create Passive Income

Real estate is a potential income investment, but many investors may overlook the possibility because of the high barriers to entry. Real estate can require large capital outlays to initiate the investment. Real estate can also be costly to get in to, and out of. Those factors could prevent investors from considering real estate.

We explain how investors can use crowdfunding to create passive income. You can learn more here.


Passive Income

How Real Estate Crowdfunding Can Create Passive Income

real estate crowdfunding

Real estate is a potential income investment, but many investors may overlook the possibility because of the high barriers to entry. Real estate can require large capital outlays to initiate the investment. Real estate can also be costly to get in to, and out of. Those factors could prevent investors from considering real estate.

But, there are new options available to smaller investors. Among those options are crowdfunding, an investment opportunity where individuals pool their assets to purchase real estate and participate in the potential gains and income from the property.

Crowdfunding also eliminates the need to research which properties to buy and the requirement to manage the investment property. But, crowdfunding can provide some of the same benefits a more active investor would enjoy such as tax benefits.

“The IRS allows investors to deduct depreciation of income-producing properties,” Steve Azoury, owner of Azoury Financial recently told U. S. News and World Report.

“For someone who owns a large amount of commercial property that produces a significant amount of taxable income, these deductions can be extremely valuable,” and real estate crowdfunding yields these same benefits to investors in a streamlined way.

The First Decision Facing Real Estate Investors

As with any other portfolio decision, an investor must start with high level decisions. The first decision is a familiar one, investors must select debt or equity. This is the same choice that investors in real estate investment trusts must make.

Equity investments in real estate offer the potential for price appreciation. They are also subject to losses if the value of the property decline. Debt investors face the same risk but they enjoy steady income and risks are reduced by the same foreclosure process that protects mortgage investors.

It is not always that simple. Some investment opportunities will combine both elements of the debt and equity investments.

The next decision for an investor is which crowdfunding platform to use. Although there are dozens of platforms available, investors should consider using the larger ones with an established track record. Smaller investors will also face limited options based on the minimum required investment.

Fundrise offers individuals access to real estate with a minimum investment of $500.

Fundrise

Source: Fundrise

Fundrise allows individuals to invest online in commercial real estate via eREITs and eFunds. Individuals can gain access to real estate deals without the high dollar commitment typically needed, without being an accredited investor and without paying the high front-end load fees.

However, it is important to remember that these are illiquid investments which means that your investment capital could be tied up for years in a Fundrise account.

Investors can participate in real estate deals through Fundrise with as little as $500 of capital and they can receive monthly income through this platform. It is possible on many deals to reinvest dividends if you choose to in order to compound wealth.

Returns can be higher for illiquid investments and this is true for a recent deal that Fundrise was offering. Investors in the starter portfolio were able to obtain passive income at an annualized rate of 6.08% per year.

current annualized dividend yield

Source: Fundrise

Another option is Groundfloor, an online platform specializing in lending for single-family or small multi-family home rehab and renovation loans. The firm provides access to short-term, high-yield returns with a minimum investment of less than $500.

Groundfloor details

Source: Groundfloor

Typical loans return 6% to 25% annually and loans generally carry a term of six to twelve months.

A real estate investor secures a loan through Groundfloor rather than a traditional bank or a hard money lender to finance a residential real estate project. That borrower submits a loan application and after review, the loan is assigned a loan Grade A through G and a corresponding rate where Grade A loans are the least risky, with the lowest rate of return and Grade G loans are most risky.

Grade A loans generally offer returns of 6.5% and Grade G loans generally offer returns of 25% with each letter grade offering a rate within that range.

As an investor, you can browse the summary view of loans funding on the Groundfloor web site or view more information on the loan detail page for each loan. You decide when, how much, and where to invest. Investing is simple and efficient.

With Groundfloor you are, in effect, allowed to create your own REIT. When you invest your money with a REIT, the REIT manages your risk and reward. With Groundfloor you choose how much, when, and in what properties.

The same is true of other crowdfunding sites which include RealtyShares, which reports funding over 1,000 projects and returning more than $120 million to investors, and PeerStreet, a marketplace where accredited investors can invest in high-quality private real estate loans.

Not all investors will qualify for sites that serve only accredited investors. Generally, to be considered an accredited investor, an investor will need a net worth of at least $1,000,000, excluding the value of one’s primary residence, or have income at least $200,000 each year for the last two years (or $300,000 combined income if married) and have the expectation to make the same amount this year.

The term “accredited investor” is defined by the Securities and Exchange Commission and is generally not waivable. However, there are many crowdfunding sites that allow nonaccredited investors to participate.

Crowd funding real estate is an opportunity that investors should be aware of and is something income investors should consider as a source of passive income. However, the risks should not be ignored and illiquidity should be considered when making the investment.

For now, it is still a small market. Crowdfunded real estate investments account for $2.5 billion of the $7 trillion commercial real estate market, according to CFX Markets. There is major growth potential in the industry as more investors lock in on the benefits of investing in real estate through crowdfunding platforms.

There’s also significant potential for individual investors interested in passive income and exposure to the real estate market.


Stock Picks

This Sector Appears to Be on the Path to Recovery

top down approach

Traders can find value in a top down investing style. This methodology, as its name implies, starts at the top and drills down.

The top is the major stock market averages. Here, many investors choose to keep their approach simple and they focus solely on the trend. They may just use a single moving average (MA), such as the 200 day MA. If prices are above the MA, the trend is up. Otherwise, the trend is down.

Right now, that analysis tells investors that the direction of the trend is up, and they should consider buying stocks.

The next step in a top down analysis is to consider sectors and industries. A sector is the broader category and the industry includes the more specialized companies. For example, within the capital goods sector are the home builders.

The chart below shows that the SPDR S&P Home Builders ETF (NYSE: XHB) is on a momentum buy signal.

XHB weekly chart

This is a weekly chart of the price action. Daily charts will offer more trading signals, but weekly charts could prove to be the most useful for individual traders who tend to be pressed for time and often won’t be able to take all of the signals on daily price charts.

At the bottom of the chart is the MACD indicator. This indicator is designed to measure momentum by measuring the distance between two moving averages of price. The indicator consists of several components and just one is shown in the chart.

The histogram in the chart offers a simple way to evaluate the status of the indicator. When it is above zero, it is bullish since momentum is positive. When it is below zero, momentum is falling and the indicator is bearish. In the chart, green shows a positive value of MACD and red represents a negative value.

Experts Confirm the Chart

Barron’s recently published a look at the home building industry and set the stage with a broad look at the fundamentals. That analysis noted,

“To profit from a potential correction in overvalued commercial real estate, BCA Research recommends a circuitous route: buy home-builder stocks and sell short real-estate investment trusts.

Ultra-cheap credit has inflated a bubble in CRE, according to BCA’s U.S. Equity Strategy’s special report. CRE debt hit a record for U.S. banks’ assets and dwarfs residential loans in terms of both growth and absolute levels, it adds. That makes CRE more vulnerable to rising interest rates given the excesses that are concentrated in this sector.

The bust in residential housing was a “once-in-a-lifetime crisis,” BCA argues. Unlike CRE–where overbuilding has resulted in problems for borrowers to service debt, portending increasing delinquencies, charge-offs and delinquencies–there’s a widely noted shortage of supply for new and existing homes for sale.”

With the industry now highlighted by the top down analysis, it is time to drill down to individual stocks to find potential buying opportunities.

Finding Value in Home Builders

One approach to stock selection is to use fundamental analysis. With this approach, an investor looks for stocks that offer the best value. When combined with the top down methodology, it means finding value in the selected industry to buy during a bull market in stocks.

The chart below compares some of the largest companies in the industry. The price to earnings (P/E) ratio is a popular valuation metric. The chart shows the P/E ratios based on both this year’s and next year’s expected earnings per share (EPS).

big builders

Source: Barron’s

The dividend yield and the price to book, or P/B, ratio are also shown for each stock. An investor can use just one or combine all three of these valuation tools in their decision. To keep this analysis simple, we will use only the projected P/E ratio.

In both years, the lowest P/E ratio belongs to Toll Brothers (NYSE: TOL).

“There is a disconnect between our business and the share price,” Toll CEO Douglas Yearley recently told Barron’s. “The stock was $52 in January, and it’s $37 today. Throughout that period of time, business has been good, and we’ve done a terrific job diversifying the company.”

At least some analysts agree with the CEO. In Barron’s, we learn:

“Toll has a high-quality land base and a good management team that has the ability to deploy capital through buybacks and other actions to improve returns,” says Michael Dahl, an analyst with RBC Capital Markets.

He maintains that the builder has a “compelling valuation” amid “intense negative sentiment” among many institutional investors. Dahl has an Outperform rating on the shares, with a $46 price target, 24% above its current quote.

Toll trades for 1.3 times its book value of $29 a share, a discount to most peers. Book could reach $35 by the end of the next fiscal year in October 2019, and it should be a floor under the stock, assuming that Toll remains solidly profitable.

Toll has sought to boost returns in part by holding less land on its balance sheet, helping to lift its return on equity to 15% from 9% in 2016.”

Management and analysts believe in the company. The chart of TOL is shown below.

TOL weekly chart

Again, MACD is shown and again the indicator is supporting a buy recommendation. In this chart, MACD remains negative but it is rising. The arrow highlights what technical analysts call a bullish divergence.

A divergence forms when prices and momentum move in opposite directions. Technicians expect momentum to lead price and they expect a divergence to be resolved in the direction of the momentum indicator.

When prices are down, and momentum fails to make a new low along with price, that is considered to be a bullish divergence. Since momentum leads price, this is looked at as a signal that the stock price is likely to reverse to the up side.

TOL is a buy, based on a top down analysis that moved from the broad stock market to individual stocks. This type of analysis could be useful since it can highlight ETFs that are attractive, like XHB, or individual stocks to consider, like TOL.


For other market tips and products, click here.

Value Investing

Stocks Are Overvalued: Here’s What That Really Means

value investing

Value investing is simple in theory. The general idea is to buy stocks that are undervalued. They are held and eventually sold when they become overvalued. That is certainly a simple theory. But, the implementation of that simple theory can be a problem.

First, the value investor must define value. Then, definitions of undervalued and overvalued are needed. This can, of course, all be done with precise formulas. However, precision can actually be little more than false comfort to value investors.

In the stock market, prices that seem to be undervalued can become more undervalued. Overvalued stocks and markets can become more overvalued. This is why it can be better to consider broad guidelines when developing a value investing framework.

Defining Value

The first problem of the value investor is to select a measure of value. There are many possibilities. One, for determining the value of the stock market is the Shiller CAPE ratio.

This metric is the cyclically adjusted price-earnings (or CAPE) ratio developed by Nobel Prize winning economist Robert Shiller. It compares current prices to average earnings over the past 10 years adjusted for inflation. It’s intended to measure earnings over the course of an entire business cycle.

The current reading of the CAPE and its history back to the 1800’s is shown below.

CAPE and its history

Source: multpl.com

It’s important to note that the CAPE ratio can also be applied to individual stocks. That is actually the measure of value that Ben Graham, Warren Buffett’s business school professor, advocated using in his book, The Intelligent Investor.

Graham thought it was important to consider earnings of a company over an entire business cycle, a thought process that is similar to the logic underlying Shiller’s model for the stock market as a whole.

From the chart above, we can see that this metric indicates the stock market is overvalued.

But, a less inclusive look, the P/E ratio using just one year’s worth of earnings, is not quite as overvalued.

PE ratio using one year earnings

Source: multpl.com

This illustrates one of the problems a value investor faces. The different measures of value can provide conflicting information.

Why Valuation Matters

Valuation measures are important because they are a significant component of market returns. One analyst notes, “the trend in P/Es is the most significant determinant of stock market returns.

There are only three sources of returns from the stock market: earnings growth, dividend yield, and the change in P/E (the overall level of valuation in the market). To illustrate the impact of the P/E cycle, we can assess stock market returns over the past century by breaking the long-term into relevant periods for most investors—decades rather than centuries.

Since 1900, there have been 97 ten-year periods (i.e. 1900-1909, 1901-1910, etc.). As most investors know, the average long-term return from the stock market has been 10%; and that is the average of all 97 decade-long periods.

It is striking, however, that average rarely happens. None of the 97 periods were exactly 10%—all were either above-average or below-average. So the only wrong answer for investors is to assume the long-term average.

A wiser choice is to decide that it is more likely from today either to be an above-average decade or one that will be below-average. For insights into which is more likely, we can [consider] the three components of stock market return: earnings growth, dividend yield, and the change in P/E.

Figure 4 is enlightening: our hero, the P/E, is the major driver of whether returns are above or below average. The generally more stable combination of earnings growth (blue) and dividend yield (brown) is pulled in both directions by the trend in P/E.

When the P/E was trending upward, the green-shaded addition to the bars provides above average returns; whereas, when the P/E was trending downward, the red-shaded pull mutes returns into a below-average result.”

secular stock markets explained

Source: Crestmont Research

This means that value matters in the long run. And long-term gains are likelier when the P/E ratio is low than when it is high. The next chart illustrates this relationship.

The Valuation Bull's Eye

Source: Business Insider

Notice that with the P/E ratio currently above 20, the stock market is likely to deliver below average returns. But, the chart also shows that high returns are also possible.

The chart above shows both an average and a median value for returns. The average is a calculation many investors are familiar with. It is found by summing the individual returns and dividing by the number of returns in the sample.

The median is the middle value. If there are eleven values, for example, the median is the sixth value when they are ranked from high to low. There are five values above that level and five that lie below the median value in this case.

Notice in the chart above that when the P/E ratio is above 20, the average return is negative while the median value is positive, at 4.43%. This indicates the average is skewed by at least one very negative value that is bringing the average significantly below the median value.

That is an important insight for value investors to keep in mind. It is also important that no individual year is likely to be average. In fact, every year is likely to be either above average or below average.

In a market such as this one, where the valuation metrics of the market and of many individual stocks are higher than average, selectivity becomes key. In the words of some traders, this is a market of stocks rather than a stock market.

There are values in the market, but they will require research. There could be more value among smaller cap stocks because smaller stocks are generally less widely followed than large cap stocks. Investors can benefit from, in effect, where few other investors are looking.

However, investors should be cautious about becoming too defensive in this environment. As the average value in the final chart above shows, there are at least some years when significant returns occur even when the stock market is at an overvalued extreme.


For other market related tips and products, click here.


Cryptocurrencies

This Step Could Save You From Cryptocurrency Scams

avoid scams

Scams are a part of any investment market. Within the past few weeks, the Securities and Exchange Commission (SEC) took action against an investment advisor that “engaged in a fraudulent trade allocation scheme, or “cherry-picking,” that harmed their advisory clients.”

The SEC also took action against individuals who failed to follow professional standards and allowed public filings to show that a publicly traded company contained material misstatements that significantly overstated its value, potentially causing losses for individual investors.

The investment advisor community and public companies are mature markets. Yet, there is still a need for regulators because occasionally individuals will act in ways that are contrary to the public interest. Given that fact, it’s not surprising that problems will be found in new markets like cryptocurrencies.

Investors have learned to pay attention to caution flags in the stock market. And, there will almost always be flags.

For example, in the case of Bernie Madoff, investors overlooked many items they should have researched further to buy into what was really a multibillion dollar Ponzi scheme.

In hindsight, many analysts pointed to the steadiness of returns as a warning. Now that we know it was a fraud that makes sense but in real time, investors seek steady returns and that would not usually be a warning of fraud.

In real time, to cite one example, was that fact that funds were paid directly to Madoff. There was no custodian and no one else involved in that transaction. That is always a flag and could have been enough to warn investors.

Caution Flags Shouldn’t Be Ignored

With any investment, caution flags should always be investigated. A caution flag could be numerous complaints in the public record of an investment adviser or acquisitions involving shell companies that involve millions of dollars of assets that are not easily identifiable as assets.

There are also flags in the crypto markets. One flag investors should not ignore is the fact that many cryptocurrencies are, more than 1,000 projects by one count, have failed in the first months of 2018. At least two sites are actively cataloging failed crypto projects, Coinopsy and DeadCoins.

The projects include some cryptos that simply failed despite the best faith efforts of their developers to outright scams that have resulted in SEC investigations. These projects, no matter what the cause of their demise, have cost investors billions of dollars. Many projects are initial coin offerings or ICOs.

According to TechCrunch, “scam and dead ICOs raised $1 billion in 2017 with 297 questionable startups in the mix.

There are dubious organizations dedicated to “repairing” broken ICOs, including CoinJanitor from Cape Town, but the fly-by-night nature of many of these organizations does not bode well for the industry.”

amount raised by all ICOs

Source: Blog.ICOBazaar.com

The market is large because it does offer investors opportunities.

ICOs Carry Large Potential Returns

A recent study by two Boston College researchers, Digital Tulips? Returns to Investors in Initial Coin Offerings, created “a dataset on 4,003 executed and planned ICOs, which raised a total of $12 billion in capital, nearly all since January 2017.”

The authors concluded, “We find evidence of significant ICO underpricing, with average returns of 179% from the ICO price to the first day’s opening market price, over a holding period that averages just 16 days.” That means investors in all offerings would enjoy a significant return.

“Even after imputing returns of -100% to ICOs that don’t list their tokens within 60 days and adjusting for the returns of the asset class, the representative ICO investor earns 82%.”

post-cumulative returns

Gains were possible even if investors bought after the ICO, “After trading begins, tokens continue to appreciate in price, generating average buy-and-hold abnormal returns of 48% in the first 30 trading days.”

ICOs Also Carry Risks

The study also studied what happened after an ICO. Using a company’s Twitter activity as a signal that it was still functioning, the researchers determined that 56% of startups that used ICOs to raise money failed within just four months of their ICO.

Failure could mean a complete loss for the investors. That indicates there are some very successful offerings that result in large gains but more than half cost investors significant amounts of money.

Experts warn that are some important flags to watch for:

  • ICOs should include details of the smart contract they will use. If there is no mention of a smart contract, the offering could be a scam.
  • Projects should include a list of people working on the ICO. Anonymous offerings are a possible scam.
  • A plan for the use of proceeds and an offering in that amount. An offering seeking to raise a large amount of money should be viewed with caution.
  • The plan should be understandable. If it’s overly complicated or poorly written, risks may outweigh rewards because the team may not have the skill set to execute the project.

One other factor cited by the Boston College study was the fact that few of the failures were traded on an established exchange. This indicates investors should limit their crypto purchases to currencies that are available on an exchange rather than only from the project administrator.

This is important because exchanges complete at least a minimal level of due diligence. This is one level of protection investors should avail themselves of.

Finally, consider waiting. That recent study showed most ICOs are dead within four months. Simply requiring a price history of at least five months could reduce risk. For investors worried about missing out, it’s important to remember big winners play out over years.

One example of that principle is Walmart, a stock that gained 3,515% after the company opened its 1,000th store.

WMT yearly chart

Waiting for the company to become a large retailer paid off for patent investors. The same is likely to be true for large cryptos. Success will last for years and there is most likely no need to be the first to invest in a new project.


For other market related tips and products, click here.

Weekly Recap

Weekly Review

Analyzing Bitcoin in Real Time

Bitcoin and other cryptocurrencies are perfect for technical analysis. They are much like commodities markets where fundamentals play a smaller role than they do in stocks. In the stock market, earnings and cash flow are widely studied. That’s not true in other markets.

Because fundamentals represent just a small factor in the investment process, technical analysis is well suited to analyzing cryptos. We share the details Here.

Insider Buying Highlights Bargains

A recent study confirmed that parents should avoid saying things like “do as I say, not as I do” to children. The children learn from watching and the misbehavior of parents, even if the parents instruct kids to ignore it, sets a bad example.

Investors should learn from that study. As investors, we should assign more weight to what management teams do than to what they say. We dig in to the details in this article.

A Whole New Group Develops in the Stock Market

Investors sometimes think of groups as relatively unchanging. There is the mining sector, the railroads, auto makers and other clearly defined groups of stocks. The truth is that at one time, all of these were new industries and it took time for the companies to grow into a group.

In recent years, several new industries have appeared. These industries have created trading opportunities and we share the specifics right here.

Income and an Inflation Hedge, In an Obvious and Overlooked Area

Inflation is a growing concern. The truth is that inflation has been a concern for decades. One of the most significant differences between a typical bout of inflation concerns and the current round is that inflation pressures are building.

With inflation pressures building, many income investors should be increasingly concerned. In our recent article, we share a strategy that provides income and an inflation hedge. Read more here.