Passive Income

Pros and Cons of Muni Bonds Right Now

Muni Bond

A municipal bond, often called a muni bond, is a bond issued by a local government or a local government agency such as a housing authority. These bonds often fund roads, schools, airports and seaports, and infrastructure-related repairs.

This is a multitrillion dollar market that has been growing as state and local governments seek more and more funds. There are a number of different bonds issued by states, counties, cities, hospitals, local housing authorities and others.

In addition to the variety of issuers, there are a variety of bonds. Munis can be general obligations of the issuer or the repayment of the bond can be secured by specified revenues.

No matter who issued the bond or what type of bond it is, interest income received by holders of municipal bonds is often free of federal income taxes and is often exempted from state and local income taxes in the state of issue.

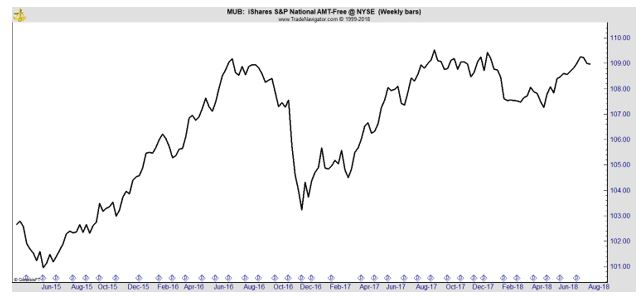
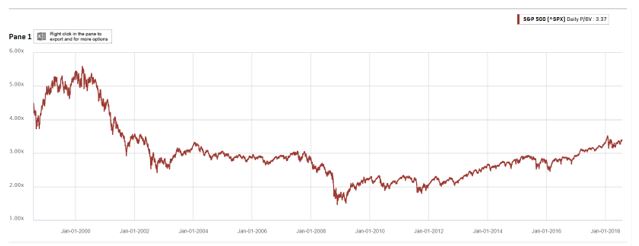
The tax free nature of the bonds makes them appealing to many investors. For example, the iShares National Muni Bond ETF (NYSE: MUB) offers a yield of 2.3%, which is equivalent to a yield of 2.9% for a taxpayer with a 22% marginal federal income tax rate and no state income tax. A state income tax could make that yield even more valuable.

To find a similar level of income in government bonds, an investor must accept more risk. For example, if interest rates rise by 1%, the value of long term government bonds could fall by more than 15%. The same increase in interest rates is expected to decrease the value of MUB by about 6%.

The price of MUB is not as volatile as stock market ETFs and is lower than the volatility of some bond funds.

MUB weekly stock chart

Relative price stability, tax free income and less risk are advantages of investing in municipal  bonds. But, there are risks to munis.

More Supply Could Reduce Prices

The laws of supply and demand are well known by investors. When supply exceeds demand, prices fall and when demand exceeds supply, prices rise. In the case of munis, it’s likely supply is set to increase. State and city governments need more money and can’t continue to raise taxes in all areas.

One reason they need more funds is because of unfunded pension liabilities. The chart below shows this problem has been growing in recent years.

state pension deficits

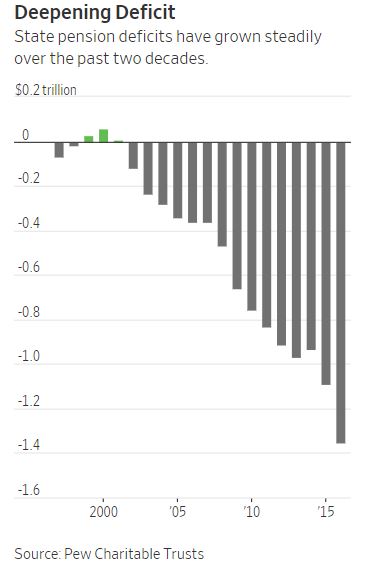
Source: The Wall Street Journal

This trend seems unlikely to be reversed in the next few years. Notice that the amount of the state pension deficits have been rising even as the stock market has been moving up in the past ten years. With the bull market likely to end soon, funds could see their unfunded positions increase.

The problem of unfunded liabilities is even larger when local government pensions are included. According to reports, “By one estimate they are short $5 trillion, an amount that is roughly equal to the output of the world’s third-largest economy.”

In addition to pensions, city and state governments face increased costs of operations. They need to fund education, road repairs, local utility services and other government functions. These costs are rising and straining budgets.

Healthcare costs are also rising. That is a well known problem but it’s impact on state and local governments is largely undefined. Part of the costs are captured in pension liabilities but services provided under Medicaid can strain budgets.

Fortunately, governments do have some room to raise taxes. The dollar amount of state and local tax receipts is below its all time highs but that is largely a function of slow wage growth.

state and local government receipts

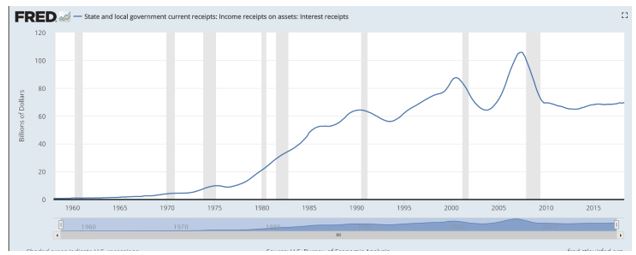
Source: Federal Reserve

In a recession, it could be difficult to raise taxes and receipts are likely to decrease when the demand for services rise.

Risks Include Local Politics

One interesting research report recently identified a risk some investors may not be aware of. The risk is that rates will rise, and prices of the bonds will fall as newspapers close. Several big city newspapers including the New York Daily News have been laying off staff and decreasing local coverage.

According to Barron’s, “When local papers close, it costs the local government money, according to a paper presented at the 2018 Municipal Finance Conference at the Brookings Institution.

“Local newspapers hold their governments accountable,” wrote Pengjie Gao of the University of Notre Dame, and Chang Lee and Dermot Murphy of the University of Illinois at Chicago, in “Financing Dies in Darkness? The Impact of Newspaper Closures on Public Finance.”

They compared municipal-bond yields for counties with three or fewer papers before and after a closure with counties with zero closures, from 1996 through 2015.

“The municipal-bond market provides an ideal setting for our study because the individual bonds are largely bought and sold by local investors, providing a more direct link between local media shocks and securities prices,” they wrote.

They found that three years after a newspaper shuts down, market yields climb by 6.4 basis points, and for newly issued bonds, yields are 5.5 basis points higher.

The effect is even more pronounced in areas with already bad governance: The authors found that newspaper closures increase borrowing costs by 12.3 basis points in states with low-quality governance, compared with only 5.5 basis points in states with high-quality governance.

And for revenue bonds, which are backed by project-specific cash flows, secondary and offering yields climbed 9.9 and 10.6 basis points, respectively. (Bond prices and yields move in opposite directions.)

The authors believe that as local papers decrease coverage of city politics, there’s less information available to the public. That increases the risk of government waste and results in a premium for the bonds.

Overall, the risks of munis are significant but the income they offer could be appealing to investors with significant tax bills. Tax reform could lower bills for many individuals but taxes will still be higher, in dollar terms, than many investors want to pay. That could fuel demand for munis.

And, all things considered, the risks of munis are in many ways similar to the risks of Treasuries and the higher income could be appealing as rates remain low.


You can click here for more market related information. 

Stock Picks

Value and Tech Can Go Together

Value stocks are often thought of as slow growing, older companies. Utility stocks are often a favorite of value investors. Tech stocks, on the other hand, are often thought of as growth stocks. These are companies that grow rapidly and often trade at high prices.

In this case, trading at high prices refers to valuation, using metrics like the price to earnings (P/E) ratio. Higher P/E ratios are justified when the company is growing quickly and could grow into the higher than average valuation.

For example, consider a company that is growing earnings per share (EPS) at 40% a year and reports EPS of $1 in the past twelve months. If the stock is priced at $30, the P/E ratio would be 30 based on last year’s earnings but just 21 based on next year’s earnings.

Rapid growth makes the stock reasonably priced even at a higher than average P/E ratio.

Valuations Matter, But There Are Some Bargains in the Market

Barron’s recently observed that “investors lately seem to have realized that stock valuations matter, even for tech superstars like Amazon.com, with its average forward P/E ratio of 180.9.

Still, tech stocks remain pricey. The average forward P/E of stocks in the Nasdaq 100 is 21.7, compared with 17.5 for the S&P 500, according to FactSet.” They then identified the five cheapest Nasdaq 100 tech stocks and noted a common theme exists in that each of the companies is involved in flash memory.

These are all stocks in the same industry and investors should not think of these five as a diversified portfolio.

Micron Technology, Inc. (Nasdaq: MU)

MU provides semiconductor systems worldwide. The company operates through four segments: Compute and Networking Business Unit, Storage Business Unit, Mobile Business Unit, and Embedded Business Unit.

It offers products for computers, servers, networking devices, communications equipment, consumer electronics, automotive, and industrial applications; lower power DRAM products for smartphones, tablets, automotive, laptop computers, and other mobile consumer device applications.

The company also provides NAND products, which are electrically re-writeable, non-volatile semiconductor memory, and storage devices; client solid-state drives (SSDs) for notebooks, desktops, workstations, and other consumer applications; enterprise SSDs for server and storage applications; cloud SSDs; and multi-chip package and managed NAND products.

MU price chart

With a P/E ratio of 5.2, MU appears attractive. But, investors in the flash memory-chip maker worry about competition from cheaper Chinese rivals that could flood the market and erode prices. Value investors have demanded that Micron shake off the doldrums, but the stock remains at a steep discount to other tech stocks.

Western Digital Corporation (Nasdaq: WDC)

WDC develops, manufactures, and sells data storage devices and solutions worldwide.

It offers performance hard disk drives (HDDs) that are used in enterprise servers, data analysis, and other enterprise applications; capacity HDDs and drive configurations for use in data storage systems and tiered storage models; and enterprise solid state drives (SSDs), including NAND-flash SSDs and software solutions that are designed to enhance the performance in various enterprise workload environments.

The company also provides client solutions that consist of HDDs and SSDs embedded into external storage products; removable cards for use in mobile phones, tablets, imaging systems, still cameras, action video cameras, and security surveillance systems; USB flash drives used in computing and consumer markets; and wireless drive products.

WDC weekly price chart

Western Digital has a P/E ratio of 6.7. Analysts note that the company has a declining hard-disk-drive unit and a flash business facing the same pressures as Micron and point out that discouraged investors haven’t bought despite 200% earnings growth over the past two years.

The concern could be that WDC faces a declining, competitive market.

Seagate Technology plc (Nasdaq: STX)

STX provides data storage technology and solutions. The company manufactures and distributes hard disk drives, solid state drives and their related controllers, solid state hybrid drives, and storage subsystems.

Its products are used in enterprise servers and storage systems applications; client compute applications, primarily for desktop and mobile computing; and client non-compute applications, including various end user devices, such as portable external storage systems, surveillance systems, network-attached storage, digital video recorders, and gaming consoles.

STX weekly price chart

Seagate Technology is trading with a P/E ratio of 10.2. Seagate’s sole focus is a shrinking hard-disk-drive market it shares with WDC. Its lack of a flash business might be the reason its P/E beats WDC’s.

Lam Research Corporation (Nasdaq: LRCX)

LRCX designs, manufactures, markets, refurbishes, and services semiconductor processing equipment used in the fabrication of integrated circuits worldwide.

The company offers thin film deposition products, including SABRE electrochemical deposition products for copper damascene manufacturing; ALTUS systems to deposit conformal atomic layer films for tungsten metallization applications; VECTOR plasma-enhanced chemical vapor deposition (CVD) and atomic layer deposition systems to deposit oxides, nitrides, and carbides for hardmasks, multiple patterning films, anti-reflective layers, multi-layer stack films, and diffusion barriers; and Striker atomic layer deposition systems that deliver conformal dielectric films for spacer-based patterning and liner applications in various advanced memory and logic structures.

LRCX weekly chart

Lam Research has a P/E ratio of 10.9. Despite growing revenues and earnings, investors remain wary and analysts are uncertain as to why.

Applied Materials, Inc. (Nasdaq: AMAT)

AMAT provides manufacturing equipment, services, and software to the semiconductor, display, and related industries worldwide.

The Semiconductor Systems segment develops, manufactures, and sells a range of manufacturing equipment used to fabricate semiconductor chips or integrated circuits.

The Applied Global Services segment provides integrated solutions to optimize equipment and fab performance and productivity, including spares, upgrades, services, remanufactured earlier generation equipment, and factory automation software for semiconductor, display, and other products.

The Display and Adjacent Markets segment offers products for manufacturing liquid crystal displays, organic light-emitting diodes, and other display technologies for TVs, personal computers, electronic tablets, smart phones, and other consumer-oriented devices, as well as equipment for flexible substrates.

AMAT weekly chart

AMAT has a P/E ratio of 11.9. Analysts worry that Applied Materials competes with Lam to supply flash-memory engineering equipment. Sales growth has not been able to overcome fears of a declining market.

These stocks offer value in a potential growth sector and could be attractive to investors seeking growth or value.


Value Investing

Right Now, the Stock Market is Actually Moderately Undervalued

market problem solving

Value investing sounds simple enough. As Warren Buffett and other great practitioners have explained it, the idea is to find assets that are trading for less than their fair value. Buy them at a discount and wait for the discount to disappear at which time they can be sold.

As individual investors know, that description does nothing to provide practical advice. To begin with, we need to define value and that is not done in the general description. Then, we need to know the difference between undervalued and overvalued.

It is possible that a stock will appear to be undervalued using traditional valuation tools but, in reality, the stock will be expensive. The problem is that companies in financial distress will deserve to trade at low valuations, deceptively appearing to be undervalued.

Trying to Solve the Problem Might Have Made Value More Difficult to Understand

Investors have understood the difficulty of value investing for decades and they have attempted to find solutions to the problems. The potential solutions have led to a proliferation of valuation indicators.

Valuation indicators include the popular price to earnings (P/E) ratio. This indicator compares the stock price to the company’s reported earnings per share (EPS). This is perhaps the simplest valuation tool but holds a surprising degree of complexity.

The P/E ratio can be applied to individual stocks or the stock market as a whole. The chart below applies the concept to the market as a whole, showing the P/E ratio for the S&P 500 index.

S&P500 index

Source: Standard & Poor’s

High readings indicate overvaluation. This chart appears to show the index, which is a proxy for the broad stock market, is overvalued. But, some analysts argue that earnings can be manipulated and that makes the P/E ratio less reliable than it could be.

There is some truth to this idea but the word “manipulation” can carry a negative connation. The truth is that earnings depend on a number of management assumptions. These assumptions are within the scope of management’s duties but lead to variations of what’s included and not included in EPS.

To overcome this variability, analysts have come up with other ratios. Another popular ratio is the dividend yield which is shown in the next chart. Lower dividend yields indicate overvaluation since lower yields indicate less income for investors.

dividend yield

Source: Standard & Poor’s

These two charts show another problem which value investors face which is the fact that many indicators will show the same message. One approach to addressing this problem is to consider a large number of indicators.

By using a large number of indicators based upon different aspects of a company’s or index’s financial health, the investor can gain a different view into the market.

Of Two Dozen Indicators, Some Are Bullish

The chart below takes this approach and uses valuation metrics that measure the market’s earnings, balance sheet information, cash flow and other fundamental factors.

high valuations by most every measure

Source: CMG Wealth

Notice that just a few of the indicators are either fairly valued or undervalued. These indicators are based on measures that calculate returns to investors and cash flow.

These could be the most important valuation metrics even though they are among the less widely followed indicators.

The term shareholder yield captures the three ways in which the management of a public company can distribute cash to shareholders: cash dividends, stock repurchases and debt reduction.

Dividends are the most obvious form of distributing cash. Stock repurchases also increase shareholder value provided that the shares purchased are cancelled or held in treasury but not used as a device to make up for dilution from option issuances to management and others.

Reducing debt can also produce a de facto dividend; assuming the value of the firm remains the same, shareholder value is increased as debt is reduced.

To understand how debt reduction increases shareholder value, it is helpful to consider the 1958 paper by Nobel laureates Franco Modigliani and Merton H. Miller entitled The Cost of Capital, Corporation Finance and the Theory of Investment. This is one of the fundamental papers in finance.

This paper proved that a firm’s value is independent of how it is financed, provided that one ignores the tax effect of debt interest. If Modigliani and Miller are correct, the use of free cash flow to repay debt results in a transfer of wealth from the debtor to the shareholder. Shareholder yield assumes they are correct.

Shareholder yield is a fairly new concept. The term appears to have been first used by William W. Priest of Epoch Investment Partners in a paper in 2005 entitled The Case for Shareholder Yield as a Dominant Driver of Future Equity Returns as a way to look more holistically at how companies allocate and distribute cash rather than considering dividends in isolation.

This indicator, as the chart above shows, indicates there is potential up side in the S&P 500. Measures based on free cash flow confirm this.

Free cash flow represents the cash a company can generate after required investment to maintain or expand its asset base. It is a measurement of a company’s financial performance and health. Free cash flow is the cash flow available to all investors in a company, including common stockholders.

It’s interesting that measures show up side potential because they may be the most important factors to investors and to companies.

Shareholder yield, as noted above, measures how companies are rewarding investors. Free cash flow measures how much capital companies have available to reward investors.

Current levels of these indicators tell us that management teams have capital that they can use to grow their companies and reward shareholders. The shareholder yield indicates much of the free cash flow is going into reinvestment. This bodes well for the future.

It is also important to remember that EPS and other financial information can be affected by management’s decisions. But, shareholder yield and free cash flow are generally considered to be among the variables that can be least manipulated. And, they tell us stocks are undervalued now.


Cryptocurrencies

Futures Could Be Your Key to Bitcoin

Key to bitcoin


Trading bitcoin can be appealing to many investors. But, the mechanics of trading bitcoin can be daunting to many. It’s not as simple to buy a bitcoin as it is to buy a stock, and that fact might mean some investors are ignoring the opportunities in cryptocurrencies.

Futures markets could provide a simpler way for investors to access the crypto markets. Futures markets are leveraged markets where investors post a small amount of money to benefit from the movements of a financial instrument like a ten year Treasury note or a physical commodity like coffee.

Many investors consider futures to be risky. And, they are risky. But, all investments are risky. And just like in the stock market one of the best tools for managing risk is education and knowledge. Informed investors can avoid many of the pitfalls of many markets.

Risks and Rewards Could Make the Effort Worthwhile

To begin with, it is important to note that futures are considered to be among the riskiest of all investments. That means they also offer significant potential for rewards since risk and potential rewards are directly correlated.

the risk-reward trade-off

Source: SlideShare.net

One example of the market is detailed at NerdWallet.com, “An airline company may want to lock in jet fuel prices to avoid an unexpected increase. So it buys a futures contract agreeing to buy 1 million gallons of fuel, taking delivery 90 days in the future, at a price of $3 per gallon.

Someone else, a fuel distributor perhaps, wants to ensure that it has a steady market for fuel. It wants to protect against an unexpected decline in fuel prices, so it will enter into a futures contract. It agrees to sell that 1 million gallons of fuel, delivering it in 90 days, at a price of $3 per gallon.

In this example, both parties are hedgers, real companies that need to trade the underlying commodity because it’s the basis of their business. They turn to the futures market to manage their exposure to the risk of a price swing.”

In the futures markets, speculators can also participate and that includes individuals. An individual might believe that the price of fuel is set to decline. There might be a contract for 100,000 gallons of fuel that is trading at $3.10. The individual could trade that contract to benefit from their opinion.

Now, futures are leveraged which means individuals trade with just a fraction of the funds. For example, in the Treasury market, an investor might need just $5,000 to benefit from $100,000 worth of Treasuries.

If the price moves by 1%, the $1,000 gain or loss will be a 20% return on the individual’s leveraged investment. In the simplest terms, this is the appeal and risk of the market.

Bitcoin Futures

Futures on bitcoins have been available at exchanges since late last year. These contracts allow for leveraged exposure to the markets. This could be interesting to many individual investors because futures can be traded at many brokerage firms.

It can be relatively simple to open a futures account or to add futures trading privileges to an existing broker. The transaction is done in U. S. dollars and does not require access to online wallets or specialized hardware as many crypto accounts do.

The contract available through CME is for 5 bitcoins and requires a margin of about 40%. That means traders may need to have substantial capital to trade this market.

The recent price of bitcoin was about $7,350. The futures contract would cover 5 bitcoins, a total value in this example of $36,750. The margin required for trading is about 40% of that amount, or about $14,700. It could be more or less than that based upon market conditions and your broker.

For this amount, you can enjoy significant gains if you are on the correct side of the market.

Bitcoin futures chart

As the chart above shows, the recent move of $2,735 in bitcoin would have delivered a gain of $13,675 to traders using bitcoin futures. Of course, it is unlikely to capture 100% of the up move but gains could still be significant if only part of a market move is captured.

One benefit of futures markets is the ability to go long or short with the same level of effort. In the stock market, trading on the short side to benefit from an expected drop in price requires borrowing shares and carrying costs. That is not true in futures where short trades are simpler and often less expensive.

This means traders can quickly reverse positions, benefiting from gains or losses in the value of bitcoin. In the futures markets, traders are seeking to benefit from volatility. And according to Bloomberg’s Matt Levine, volatility in bitcoin is significant:

“The average annualized daily volatility of Bitcoin against the U.S. dollar, over the past year, is about 90 percent. That implies, loosely speaking, that about one day out of every 20, Bitcoin will move by more than about 11 percent against the dollar.

In fact, Bitcoin has had daily moves of 10 percent or more on 22 days over the last 12 months, including 10 so far in 2018; seven of the 10 big moves in 2018 have been down 10 percent or more.”

Now, there is no way to know whether the next big move in bitcoin will be up or down but there is a near certainty that there will be a big move.

However, the chart below indicates a short term down move is likely given the readings in the stochastic indicator in the center of the chart and the MACD at the bottom of the chart. These are popular momentum indicators.

Bitcoin daily chart

Traders with a futures account could short one contract and use their stock holdings or Treasury bills for margin on the position. It is a risky trade but if short term trades result in gains, wealth could be compounded quickly.

This is a strategy for only the most aggressive traders, as are many trades in the crypto space. But, given the potential gains the trades would be worth considering for some invetsors.


Weekly Recap

Weekly Review

Investing in the Blockchain, Without All the Hassle of Investing in the Blockchain

Cryptocurrencies have the potential to change the financial world. They haven’t done so yet, but proponents of the asset class believe that changes will develop in the future. That’s why many buy various cryptos and hold them for potential gains.

Like any new technology, there is the possibility that cryptos will change the system. In a recent article, we discuss the changes that are possible in the financial world and explain how investors can avoid some risk when investing in the blockchain. You can read more, Right here.

Finding Value in an Overvalued Market

Let’s start by noting that the stock market is overvalued. Some analysts may argue against that premise, especially if they look at unique metrics. But, using the standard tools of fundamental analysis, the stock market is certainly overvalued. But it is still possible to find value in an overvalued market. You can learn more, by clicking here.

The Next Big Thing in Biotech and How You Can Trade This Development

Investors never get to sit back and think about success. They are always on the lookout for the next thing, the next trade that can deliver a big gain. They frequently scour industry reports from the tech sector because that’s where the gains have been in the past and where research is focused.

In a recent article, we share promising new technology and explain how you can trade this development. Find out more, Here.

Mistakes Fixed Income Investors Can Make

It seems as if income investing should be more leisurely than investments in the stock market. That would, in theory, allow time for investors to act thoughtfully and avoid many of the mistakes traders are prone to make in the stock markets.

This week, we share some common mistakes that fixed income investors make and how to avoid them. You can read the details in this article.


Passive Income

Mistakes Fixed Income Investors Can Make

mistakes

It seems as if income investing should be more leisurely than investments in the stock market. That would, in theory, allow time for investors to act thoughtfully and avoid many of the mistakes traders are prone to make in the stock markets.

Among the biases is one associated with limited attention spans. Investopedia explains, “There are thousands of stocks to choose from but the individual investor has neither the time nor the desire to research each.

Humans are constrained by what economist and psychologist Herbert Simon called, “bounded rationality.”  This theory states that a human will make decisions based on the limited knowledge they can accumulate. Instead of making the most efficient decision, they’ll make the most satisfactory decision.

Because of these limitations, investors tend to consider only stocks that come to their attention through websites, financial media, friends and family, or other sources outside of their own research.

For example, if a certain biotech stock gains FDA approval for a blockbuster drug, the move to the upside could be magnified because the reported news catches the eye of investors. Smaller news about the same stock may cause very little market reaction because it doesn’t reach the media.”

Because information on fixed income investments is generally less widely available, it’s reasonable to assume biases like this haven’t affected that market. But, new developments changed the fixed income markets and new research is being done to determine how similar investors are in these markets.

Income Investment Markets Can Be As Fast As Equity Markets

New research includes a paper titled “Investment under Fast-Thinking” which looked at a major peer to peer lending market, Renrendai, one of the leading P2P lending platforms in China. This market allows investors to fund loans with a click on their phones using information like the screenshot shown below.

loan details

Source: Investment under Fast-Thinking

This is a fast moving market. Due to the market environment, the loans on this platform were generally highly appealing and were usually sold out quickly. For example, 25% of the loans listed on Renrendai are fulfilled within 42 seconds and 90% are fulfilled in under eight minutes.

The researchers had a rich data set of 10,385 loans and 205,724 transactions, and the cumulative amount of loans in the sample is over $100 million. The data covers a time frame spanning two years and four months.

Given the fast moving market, investors focused on the interest rates of proposed loans rather than risk factors like credit scores.

Data revealed that risk and returns are directly related, just as they are in the equity markets. The authors found loans with a “High Risk” (HR) rating offered the highest interest rate but, on average, underperform other loans by over 1% per year

While investors focus on returns, they could be nudged to look at risk by simply reconfiguring the screen as shown in the figure below.

loan agreement details

Source: Investment under Fast-Thinking

Now, the risk rating is clearly visible. Regulators could do this to improve investor information but market makers could resist a change like that. One of the important lessons from this research is that investors must do their own homework.

The Conclusions Offer Hope for Investors

Another factor the researchers noted is the fact that investors can learn from mistakes. After suffering a loss, traders slow down their decision making process.

As the authors explained,

“Using data from a major online peer-to-peer (P2P) lending market, we document that investors appear to follow a simple rule of thumb: they rush to loans with high interest rates without sufficiently examining other information (e.g., borrower’s credit rating), which is freely available on the interface.

For example, on average, loans with a “High Risk” rating under-perform other loans by over 1% per year. Through experiments, we show that by making credit rating information more salient, we can “nudge” investors into paying more attention to ratings and hence improve their investment returns.

Finally, first-hand experience matters for learning: After a recent default of his own loan, an investor tends to increase his decision time, avoid loans with “High Risk” ratings, and hence obtain higher returns. In contrast, after observing others experiencing a default, the effects are significantly smaller or negligible.”

There are two lessons to learn from this paper.

Investors in any market can act too quickly, even when fast reactions can increase the risk of loss. But, investors can learn from mistakes which is beneficial but the downside of learning from experience is the fact that experience can be an expensive teacher.

These are important lessons for income investors to learn. Rates are likely to remain low, despite the fact that rates are rising. The Federal Reserve expects short-term interest rates to stabilize near 3% in the long run.

short term interest rates

Source: CNBC

This indicates rates will remain low for some time. Income investors will be tempted to reach for yield, as they have been for most of the last decade. However, the pressure to reach for yield may increase as frustration with low rates increase.

But, as the study of the peer to peer market in China demonstrated, increased yield carries higher risks and income investors must remember that the return of their principal is at least as important, if not more important, than the return on their principal.

Reaching for yield can be a good move, but it requires analysis and income investors should not make quick decisions. They should take time to understand the investment opportunity and the risks associated with the investment.

Income investors should also consider the alternatives to their desired investment. If an investment offers higher yields, there is almost certainly more risk.

Finally, income investors should think of the impact a loss will have on their portfolio. An extra 1% in yield could lead to a loss of 10% of principal and that would reduce future income by 10%, in essence forever.

Thinking fast is advantageous at times. But, in the investment markets, and particularly in the fixed income investment markets, thinking slow could be profitable in the long run.

Stock Picks

The Next Big Thing in Biotech and How You Can Trade This Development

gene therapy

Investors never get to sit back and think about success. They are always on the lookout for the next thing, the next trade that can deliver a big gain. They frequently scour industry reports from the tech sector because that’s where the gains have been in the past and where research is focused.

Among the promising technologies is gene therapy, a treatment that modifies the functions of a gene to override a mutation. According to the National Institute of Health:

“Gene therapy is an experimental technique that uses genes to treat or prevent disease. In the future, this technique may allow doctors to treat a disorder by inserting a gene into a patient’s cells instead of using drugs or surgery. Researchers are testing several approaches to gene therapy, including:

Replacing a mutated gene that causes disease with a healthy copy of the gene.

Inactivating, or “knocking out,” a mutated gene that is functioning improperly.

Introducing a new gene into the body to help fight a disease.

Although gene therapy is a promising treatment option for a number of diseases (including inherited disorders, some types of cancer, and certain viral infections), the technique remains risky and is still under study to make sure that it will be safe and effective. Gene therapy is currently being tested only for diseases that have no other cures.”

While the therapy is risky, traders know that the biggest rewards in the market are found in the riskiest sectors.

Analysts Are Noting Successes in Gene Therapy

ARK Invest analyst Manisha Samy recently shared some of her favorite ideas in the sector with Investor’s Business Daily. She started by noting that gene therapy is nothing new.

“We’ve been working on it for decades,” she said. “We’re finally seeing advances in gene therapy. Now, we can accelerate based on technical advances in genome reading. Modifying the DNA will serve as a steppingstone to (treating) more complex genetic disorders.”

One company in the sector is Sarepta Therapeutics (Nasdaq: SRPT).

Last month, Sarepta presented strong results of one gene therapy in three young boys with a muscle-wasting disease called Duchenne muscular dystrophy. To cap the presentation, all three stepped on stage, showcasing their improved ability to walk.

“You’re talking about kids, so it was emotional,” JMP Securities analyst Liisa Bayko told Investor’s Business Daily. “Anybody with a heart would feel for what these people have been through. People have risked a lot to go on gene therapy.”

The results were also dramatic for Sarepta stock, which rocketed almost 37% on June 19. It hit a record high above $176, before dropping back below $140.

SRPT daily chart

While the drug is promising, there are risks. One of the biggest risks is the cost of the drug. For Sarepta’s gene therapy, a treatment for a form of Duchenne muscular dystrophy, RBC Capital Markets analyst Brian Abrahams estimated a net cost of $1.5 million per patient. JMP’s Bayko expects a cost of $5 million.

Those costs could be justified if the drugs cure the diseases. In addition to the impact a cure would have on a patient’s quality of life, the drugs would save money in the long run. Some treatments for rare diseases can cost between $350,000-$700,000 annually and are needed for life.

That means that even at $5 million, the drugs could be a bargain for the insurance companies that are funding the costs for patients. Those savings, of course, are nothing compared to the benefits the patients receive.

Looking Forward

Of course, the stock of SRPT has already made a big move, and the drug hasn’t even been formally approved yet.

The Food and Drug Administration approved the first gene therapy drug in the United States in December. Sarepta’s drug is still in testing.

The therapy, from Spark Therapeutics (Nasdaq: ONCE), is for an eye disease that generally progresses to complete blindness.

The drug is called Luxturna and for now it is the only treatment for the inherited retinal disease.

ONCE weekly chart

Solid Biosciences (Nasdaq: SLDB)  is also working on a gene therapy to treat Duchenne muscular dystrophy. This stock has a relatively short trading history.

SLDB daily chart

Another area analysts like is in treatments for hemophilia A and hemophilia B, ARK’s Samy said. BioMarin and Spark are working in hemophilia A. UniQure targets hemophilia B. Spark also has a partnership with Pfizer in hemophilia B.

“By 2025, we believe (hemophilia) will be over a $26 billion market opportunity,” she said. But the ultimate opportunity in gene therapy will “vary by disease indication.”

But, smaller markets could also deliver gains. Ultragenyx is attacking two rare diseases using therapies acquired from Dimension Therapeutics. Audentes is pursuing a treatment for a muscular disease called X-linked myotubular myopathy.

Some markets are actually big enough for multiple gene therapy companies, Instinet’s Marai said. He notes Sarepta, Solid and Pfizer are working on rival treatments for Duchenne muscular dystrophy. Now, Sarepta is looking to move into limb-girdle muscular dystrophy.

Of all gene therapy companies, Marai is most bullish on Sarepta. Sarepta has a partnership with Nationwide Children’s Hospital, giving it access to the most pre-eminent minds in gene therapy.

“If you look at who has the best gene therapy program in the world in terms of opportunity and knowledge, data set, manufacturing and understanding, it’s unequivocally Sarepta,” he said. “AveXis has very quickly been eclipsed by Sarepta.”

Raymond James analyst Laura Chico singled out BioMarin Pharmaceutical (BMRN), one among a slew of gene therapy companies working in hemophilia A. Preventive treatment is frequent and costly. Plus, those patients still won’t have normal levels of specific clotting protein.

“With a single gene therapy administration, compared to three times per week dosing (of clotting protein replacement) dosing, you’re going to be lifting a burden on patients that is not trivial,” she told Investor’s Business Daily.

This is a new technology and it is not risk. There will be big winners in gene therapy and there will also be big losers. Investors could consider owning several of the companies as a way to reduce risk.


Value Investing

Finding Value in an Overvalued Market

Let’s start by noting that the stock market is overvalued. Some analysts may argue against that premise, especially if they look at unique metrics. But, using the standard tools of fundamental analysis, the stock market is certainly overvalued.

This can be seen in the chart below which shows the price to book (P/B) ratio of the S&P 500 index. The P/B ratio is similar to the more familiar price to earnings (P/E) ratio in that low values are indicative of more value in the stock than high values of the ratio.

stock market overvalued

Source: Standard & Poor’s

One advantage of the P/B ratio compared to the P/E ratio is that the P/B ratio is less volatile. Earnings tend to move more erratically than book value which tends to move slowly. This makes it an ideal metric for evaluating changes in valuation over time.

A Historical Perspective on Overvaluation

The chart above shows that the P/B value is elevated. The current value is 3.37, about 13% above the long term average ratio of 2.98. That fact alone is one reason to note that the market is overvalued.

But, in looking at the chart, we can see that the P/B spends a great deal of time near its current level. The chart shows that the P/B ratio has spent years near the level it is currently at, around the value of 3.0.

In fact, the P/B ratio stayed near 3 as the bull market moved higher and higher before topping in 2008. This could indicate that the average is driven, at least in part by the extremes. It could be more useful to consider the range of values that is typical for the P/B ratio.

Over the past twenty years, there are more than 5,000 individual daily values for the P/B ratio. This allows us to consider the standard deviation of the value, a statistical measure that shows the amount of variation or dispersion of a set of data values.

A low standard deviation indicates that the data points tend to be close to the mean (also called the expected value) of the set, while a high standard deviation indicates that the data points are spread out over a wider range of values.

The standard deviation of the P/B ratio over the past twenty years is 0.85. That tells us that we should expect about 68.2% of the reading to be between 2.13 and 3.83. This is derived from the normal distribution which is shown below.

standard deviation of the P/B ratio

Source: M. W. Toews from Wikimedia Commons

This indicates the stock market is slightly overvalued since the P/B value is slightly above average. But, it is not overvalued enough to make a decline and a bear market almost certain.

Finding Value

Knowing that the P/B ratio is 3.37 provides us with a quantifiable method for finding value in the market. We can look for stocks that have a below average ratio, or we could even look for stocks with an even lower ratio.

One way to find stocks meeting that requirement is with the free stock screening tool available at FinViz.com. At this site, you could screen for a variety of fundamental factors, high levels of institutional ownership and bullish institutional transactions Or, you could just screen on the P/B ratio. An example is shown below.

Finviz

Source: FinViz.com

For this screen, we selected stocks with a P/B ratio below 2. This is more than one standard deviation below the long term average P/B ratio.

When running this screen, more than 2,200 stocks, more than 30% of the stocks in the data base, were offering this level of value. This can be filtered down by adding price or volume criteria or some other fundamental metric.

When using valuation as a screening tool, it can be important to add additional metrics to avoid value traps.

The Financial Times explains what a value trap is: A financial instrument (stocks or bonds) that appears cheap on historical measures or valuation grounds, such as price/earnings ratio, but the price never recovers to fair value.

Such “bargain” investments attract buyers because they hope that the price will go up in future so they will make money. However, the problem is that the stock price can fall again and may never go up unless there is a catalyst.”

The chart below shows General Electric (NYSE: GE), a stock which may appear to offer value but has been a value trap for investors who assumed the decline in the P/B ratio (also shown in the chart) fell lower along with the price.

GE chart

Source: Standard & Poor’s

To avoid a value trap, investors can simply wait for the stock price to start moving up. This is a relative strength based investing strategy and can be more successful than a strategy that relies solely on value or relative strength.

Returning to the Finviz screen above, we saw that 2,200 stocks offer value based on a low P/B ratio. We can narrow that list with additional filters.

Some investors may limit risk by investing only in large cap stocks. This is not a guarantee of safety but there is less risk of a large cap company going bankrupt than a small cap company. Using the Finviz screener we can filter by market cap to implement this idea.

That tool defines large cap stocks as those with a market cap of at least $10 billion. Adding that requirement to the low P/B ratio requirement reduces the list of potential investments to 724.

To find stocks that are going up, we can add filters for performance. For example, we could require the stock to be up over various time frames including the last day, the last week, month, quarter, six months, year or year to date.

When using value, it could be best to use longer term filters since value is a long term strategy. Requiring a gain over the last year eliminates more than 200 more stocks.

Investors could continue adding filters, for example requiring a dividend to be paid or a dividend yield of a certain amount to obtain income and value.

With this tool, it could be possible to find value and other potential investment opportunities in any market environment.


Cryptocurrencies

Investing in the Blockchain, Without All the Hassle of Investing on the Blockchain

blockchain

Cryptocurrencies have the potential to change the financial world. They haven’t done so yet, but proponents of the asset class believe that changes will develop in the future. That’s why many buy various cryptos and hold them for potential gains.

Like any new technology, there is the possibility that cryptos will change the system. But, there is a great deal of risk. Investors in the currency accept those risks. But, many investors would like some exposure to cryptos without the high degree of risk in the currencies. This might be possible.

Investing in the Enabling Technology

Cryptos are an application of specific technologies. Among those technologies is the blockchain.

A blockchain is “a growing list of records, called blocks, which are linked using cryptography. Blockchains which are readable by the public are widely used by cryptocurrencies. Private blockchains have been proposed for business use.

Each block contains a cryptographic hash of the previous block, a timestamp, and transaction data. By design, a blockchain is resistant to modification of the data. It is “an open, distributed ledger that can record transactions between two parties efficiently and in a verifiable and permanent way”.

For use as a distributed ledger, a blockchain is typically managed by a peer-to-peer network collectively adhering to a protocol for inter-node communication and validating new blocks. Once recorded, the data in any given block cannot be altered retroactively without alteration of all subsequent blocks, which requires consensus of the network majority.

Though blockchain records are not unalterable, blockchains may be considered secure by design and exemplify a distributed computing system with high Byzantine fault tolerance. Decentralized consensus has therefore been claimed with a blockchain.

Blockchain was invented to serve as the public transaction ledger of the cryptocurrency bitcoin.”

Investors could consider investing in the companies that benefit from the technology in some way. That would include the technology companies that make the hardware to run the blockchain applications or the companies that are trying to design applications that rely on blockchain technology.

Exchange Traded Funds Could Provide Diversified Access to the Technologies

Determining which companies are involved in blockchain technology could require significant research. Then, it could require an evaluation of each company to determine whether or not that stock offers value or growth potential.

For individual investors, that level of research can be time consuming. In other investment areas, they have turned to exchange traded funds, or ETFs, to provide diversified exposure to different market factors, sectors or countries. The ETF providers have risen to the challenge of the blockchain, as well.

There are several ETFs that offer blockchain access. We describe three of them below and each one is slightly different.

Reality Shares Nasdaq NexGen Economy ETF (Nasdaq: BLCN) seeks long-term growth by tracking the investment returns of the Reality Shares Nasdaq Blockchain Economy Index (the “index”).

Under normal circumstances, at least 80% of the fund’s assets, other than collateral held from securities lending, if any, will be invested in component securities of the index.

The index is designed to measure the returns of companies that are committing material resources to developing, researching, supporting, innovating or utilizing blockchain technology for their proprietary use or for use by others (“Blockchain Companies”).

The fund is non-diversified which means a large amount of assets can be in an individual stock or industry. Its top holdings are shown below.

top 10 holdings

Source: Yahoo

BLCN provides exposure to the companies that make the hardware to run the blockchain and the software consultants that can help companies install the systems in their data centers.

Like the other ETFs described here, BCLN has a relatively short trading history as the chart below shows.

BLCN daily chart

The short trading histories make it difficult to evaluate the trend or momentum of the ETFs. That means investors are generally buying a concept with these ETFs, a one stop shop, so to speak, of an investment in the blockchain in some way.

Another ETF is the Amplify Transformational Data Sharing ETF (NYSE: BLOK). The investment seeks to provide investors with total return.

The fund is an actively managed ETF that seeks to provide total return by investing at least 80% of its net assets (including investment borrowings) in the equity securities of companies actively involved in the development and utilization of transformational data sharing technologies. It may invest in non-U.S. equity securities, including depositary receipts. The fund is also defined as non-diversified.

BLOK’s largest holdings are shown below.

BLOK's top ten holdings

Source: Yahoo

This is a more diversified approach in some ways and a more concentrated approach. BLOK includes some smaller companies and companies like Overstock.com that have simply announced plans to employ blockchain technology rather than developed proven revenue from the technology.

The holdings indicate BLOK could be considered more speculative.

A third ETF is the Innovation Shares NextGen Protocol ETF (NYSE: KOIN). The investment seeks to provide investment results that track the performance of the Innovation Labs Blockchain Innovators Index (the “index”).

The fund will normally invest at least 80% of its total assets in securities of the index. The index was designed by the fund’s index creator, to measure the performance of a diversified group of publicly-listed companies that use, or are involved in, blockchain (“Blockchain Innovators”).

Large holdings are shown below.

large holdings

Source: Yahoo

These are the large companies that could benefit from the blockchain but do not depend on blockchain for revenue or profits. It could be considered a more conservative approach to investing in the technology.

Investors could use any of these ETFs to obtain access to the blockchain technology. If the cryptocurrency market does revolutionize the financial system, some individual cryptos will do extraordinarily well.

But, investing in any crypto carries the possibility of losing 100% of your investment. That leaves many investors uncomfortable. To decrease the risks, while retaining some exposure to this emerging market, ETFs could be a suitable investment for more conservative investors.

These ETFs have the potential to benefit from the widespread acceptance of the blockchain technology that is at the core of the crypto markets. They will not deliver the same kind of gains a successful bet in crypto would have, but they are also unlikely to deliver a loss of 100%.

This could strike the right balance between risk and reward for some investors.


Weekly Recap

Weekly Review

weekly review

Three Reasons Crypto Are Set to Soar

Cryptocurrencies have both proponents and skeptics. The skeptics raise some valid points. One is that transactions take a significant amount of time to process. Another is that government regulations could harm the market. A third is a lack of liquidity. All three are being addressed. 

This week, we discussed the skeptics points, as well as the proponents and determined why crypto is set to soar. You can read it all, here.

The Truth About Warren Buffett’s Performance

Widely regarded as one of the greatest investors of all time, if not the greatest investor of all time, Warren Buffett is rightfully studied. The reason to study Buffett is to find clues about how he has delivered such extraordinary results. But, the answers have been elusive until now. You can read the answers by clicking this link

Research Proves It’s Easy to Beat the Stock Market

For many years, investors have often been told that it’s impossible to beat the stock market. This is the reason some investors choose index funds. That’s basically accepting the argument that “you can’t beat them” so it’s best not to try. This week, we shared research that proves YOU CAN beat the stock market and it’s all right here.

Experts Say These Are the Best Income Investments

Sometimes, we all need expert advice. This is obvious, but we don’t always want to accept it. Investors may find that they can succeed in the stock market without expert advice. That’s largely because the same information is available to all investors. But, in some other investment areas, the playing field isn’t as level. In our latest article, we level that playing field by telling you what the experts say are the best income investments. You can read more here.