What the Fed Could Mean For Your Portfolio
When minutes from the September meeting of the Federal Reserve were released this week, traders received confirmation that the Fed is likely to continue raising interest rates.
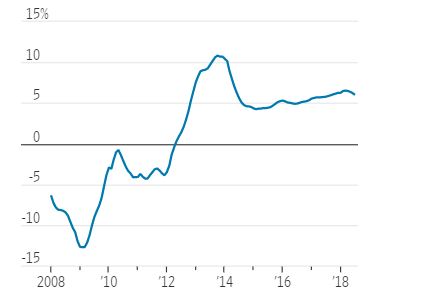
Officials voted unanimously at their meeting to raise their benchmark rate to a range between 2% and 2.25%. Projections released after the meeting show most officials expected they would need to raise rates one more time this year and around three times in 2019.
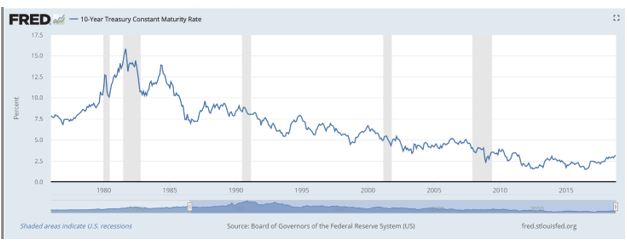
In the long run, Fed officials indicated that they expect the rate to be between 2.75% to 3%. That would be well below the rates seen before the financial crisis in 2008.
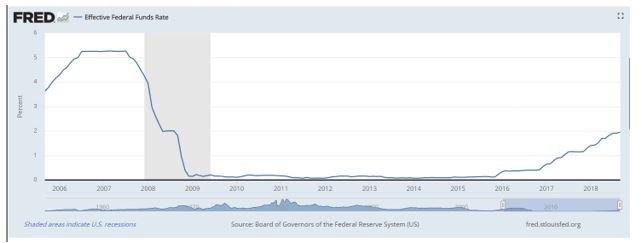
Source: Federal Reserve
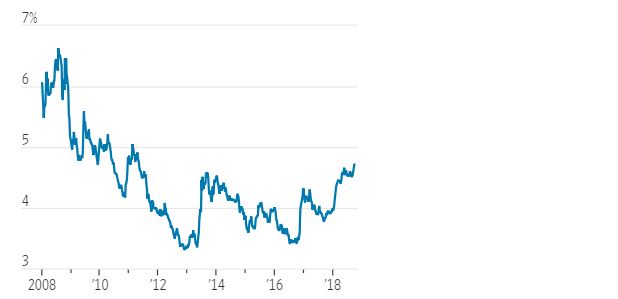
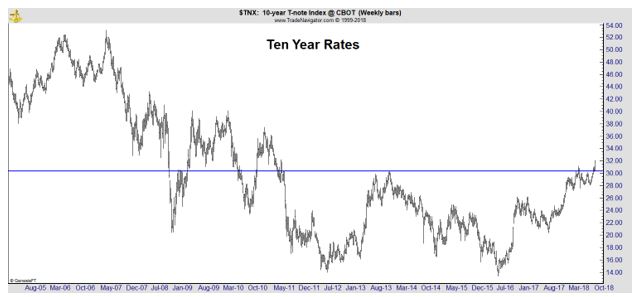
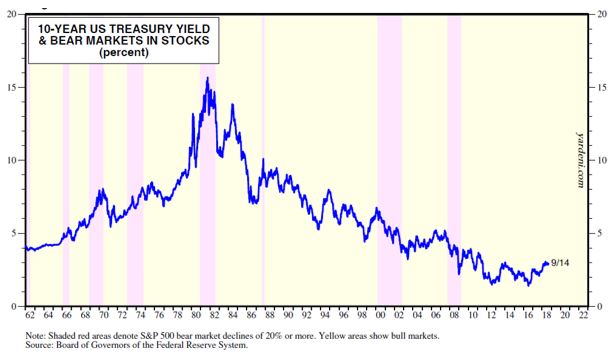
Long term rates are also below average. The 10-year Treasury was recently yielding 3.19%, up from about 2.4% at the end of last year. But it’s still well below its average nominal yield of 6.05% since 1958, according to JPMorgan
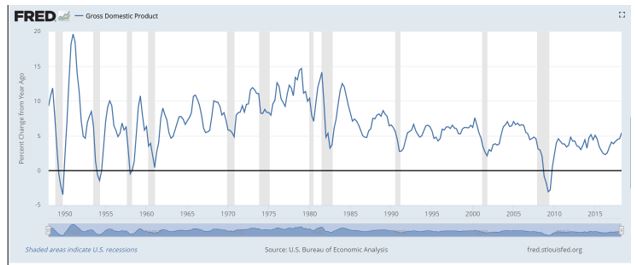
Higher rates, as the Fed expects, are based on the assumption that the economy performs in line with current forecasts. According to The Wall Street Journal,
“Federal Reserve officials signaled they see a strong economy justifying continued interest-rate increases—and said they will watch for evidence their moves are keeping economic growth on an even keel, minutes of their September policy meeting showed.
The central bank this year has grown increasingly determined to gradually lift rates to such a neutral setting because the unemployment rate is below officials’ estimates of the level consistent with stable inflation and the economy is expanding solidly.
The minutes show little consensus so far about what to do after they determine rates have reached neutral.”
What’s Next for the Fed
Many participants at the meeting said future changes in interest rates would be guided more by “the evaluation of incoming information and its implications for the economic outlook,” the minutes said.
“Estimates of the neutral federal funds rate would be only one among many factors that the committee would consider in making its policy decisions.”
New York Fed President John Williams, who has conducted leading research to estimate the real neutral rate of interest, has joined Fed Chairman Jerome Powell in downplaying policy makers’ ability to pinpoint such estimates.
Earlier this year, Mr. Williams said such estimates were shining brightly in guiding policy makers, but last month he said that now rates are closer to such a setting, “what appeared to be a bright point of light is really a fuzzy blur.”
But, not everyone agrees rates should be higher. “The Fed’s rate increases became the center of attention at the White House and on Wall Street after stronger economic data this month prompted investors to take more seriously the central bank’s telegraphed plans to steadily lift rates higher.
President Trump blamed the Fed for the subsequent market selloff and described the central bank as “crazy” and “out of control.”
Before Mr. Trump, U.S. presidents hadn’t commented publicly on monetary policy in more than 25 years. Mr. Powell and other Fed officials have said they will not be influenced by political pressure, and the minutes didn’t mention Mr. Trump’s comments made prior to the meeting.”
This creates uncertainty for investors. And, uncertainty has weighed on returns.
Returns Are Another Concern for Investors
As rates increased, investors have suffered. The Bloomberg Barclays 10-year U.S. Treasury Bellwethers index has returned -3.73% year to date through Sept. 30, and the 30-year index was off by 6.55%, according to JPMorgan Asset Management.
Also underwater over that stretch are corporate bonds, mortgage-backed securities, and municipal bonds—down 2.33%, 1.07%, and 0.66%, respectively.
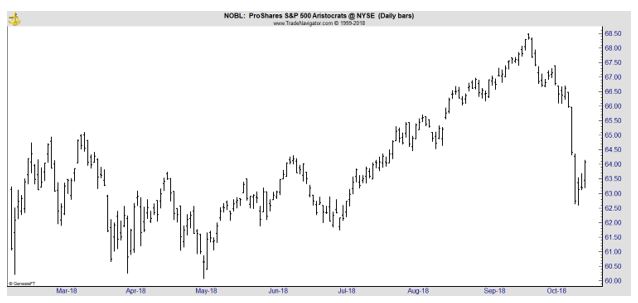
Even the relatively well-performing ProShares S&P 500 Dividend Aristocrats exchange-traded fund (NYSE: NOBL) has returned just 6.5% this year, trailing the S&P 500’s 10.9%. That ETF tracks S&P 500 companies that have raised their dividend for at least 25 straight years.
NOBL fell in line with the broad stock market last week.
Pros Differ on the Best Approach
Barron’s reviewed the current environment with two well known and highly respected fixed income fund managers.
Dan Fuss, co-manager of the Loomis Sayles Bondfund (LSBRX), said “Interest rates are rising. That, more than anything else, is the most important thing right now.”
“Concerned about rising rates, Fuss has positioned the $12.1 billion fund more defensively by adding a lot of holdings with shorter maturities. Shorter-dated credits help to buffer the impact of rising rates, as bonds with longer maturities will make more payments than shorter-term holdings.”
In theory, the present value of those future cash flows can take a big hit when rates rise. Fuss has also put more emphasis on higher-quality issues.
If rates were to rise another percentage point in a short time, longer-dated Treasuries “will probably outperform long corporates, but they will still get whacked 7%, 8%, 9%, 10%” in price, says Fuss. “That’s not good.”
He also has increased the percentage of highly liquid holdings, including Treasury bills, to about 35% of the portfolio.
“We are waiting for rates to go higher and spreads to widen out,” he says. “We are just much more conservative.”
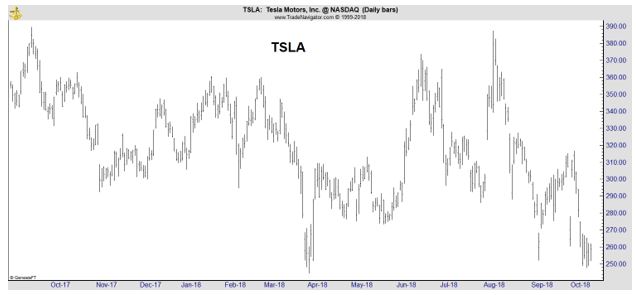
Barron’s also spoke with Clyde McGregor, who co-manages the Oakmark Equity & Income fund (OAKBX). Oakmark’s returns are higher in the long run because of its exposure to stocks.
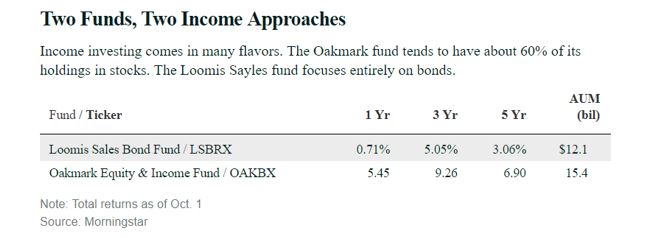
Source: Barron’s
Oakmark’s McGregor has a value investing framework focused on “how something is priced,” he notes.
“Income has been overpriced” and “we have been defensive for quite some time, relative to duration risk,” referring to the risk bonds face when interest rates spike.
As of June 30, Oakmark Equity & Income had about 55% of its holdings in U.S. stocks and another 6% in non-U.S equities, according to Morningstar. Another 23% was in bonds, though only a tiny sliver of those holdings were in credits with maturities of more than 10 years.
The fund’s largest stockholdings included General Motors (NYSE: GM), Bank of America (NYSE: BAC), TE Connectivity (NYSE: TEL), and Mastercard (NYSE: MA). Their respective yields were recently 4.5%, 2%, 2%, and 0.4%.”
Income investors might find any of those stocks to be appealing, or they could allow Fuss or McGregor to navigate the environment for them.