Uncategorized

Here’s Why Missing the Ten Best Days Could Be Good For Investors

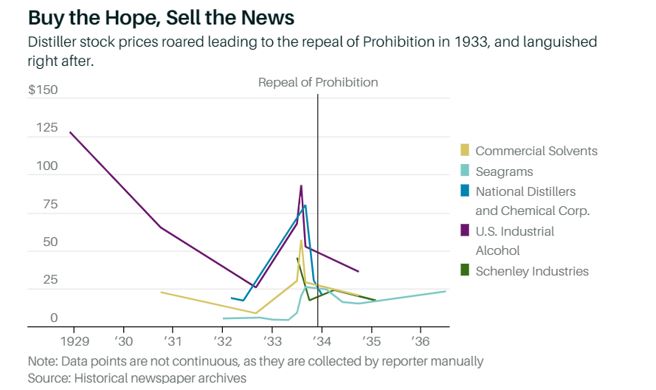
It’s a chart that financial planners like to pull out when the stock market sells off. Recently, the story was told by MarketWatch and included the chart below.

ten best days

Source: MarketWatch

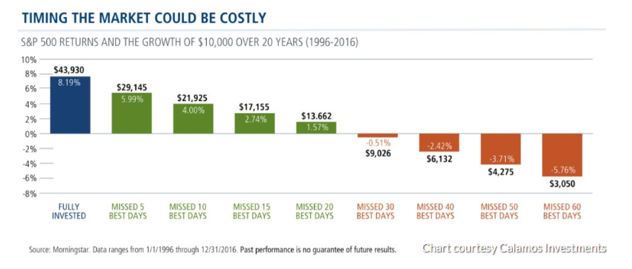
The chart shows that missing out on the 10 best days in the stock market reduces your gains by more than half when compared to a buy and hold strategy. Missing just the 30 best days results in a loss over the 20 year period that was studied.

The details appear to confirm the chart, at first glance: “Over the 20 year period between 1996 and 2016, a substantial portion of the total market’s return came from only a handful of days.

And as no one can know ahead of time when such days will occur, trying to trade into them, or in anticipation of them, can mean missing out on steep upward moves.

Per an analysis by Calamos Investments, $10,000 invested in the S&P 500 SPX, +1.57%   at the start of 1996 would’ve grown to $43,930 by the end of 2016, assuming the investor took a buy-and-hold strategy.

That’s a strong annualized return of about 8.19%, although that return is below historical averages, given that period includes both the dot-com bubble bursting and the financial crisis.

Miss the five best days of that period, however, and the amount you’re left with shrinks by more than a third, to $29,145, which represents annualized gains of 5.99% from the initial $10,000. The more “best days” you’re not invested for, the worse off the end result looks.

If you missed the top 30 sessions of that 20-year period, in fact, you would’ve lost money, with your initial $10,000 investment shrinking to a little over $9,000.”

The point the authors of these exercises are trying to make is that you should not try to time the market. Instead of that, you should simply buy and hold because the potential penalty associated with missing just a few of the best days is so high.

These studies highlight the fact that best days occur at random times and there is no way to know which day will be the next big up day in the stock market. But, is that really true? Are big gains in the stock market completely random? That deserves some study.

Digging Deeper

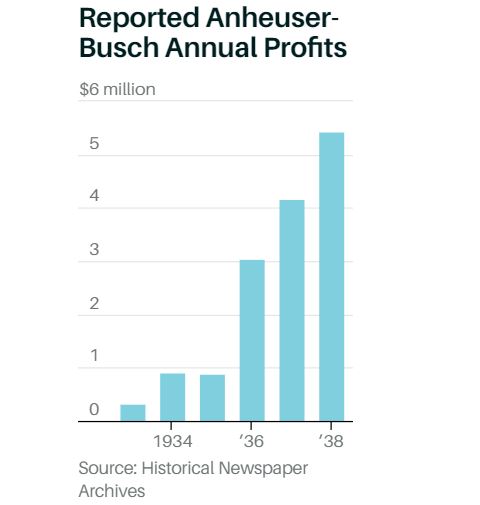
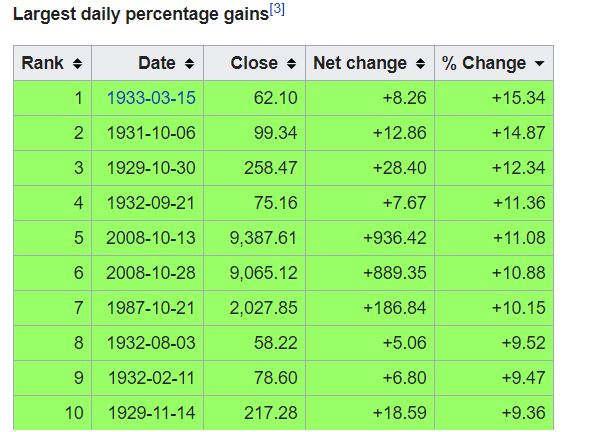
The next chart shows the ten best days for the Dow Jones Industrial Average. This will allow for developing some context about missing the ten best days.

largest daily percentage gain

Source: Wikipedia

Two of the ten days came in the bear market that began in 2008. Six of the ten days came in the bear market that began in 1929. That accounts for eight of the ten biggest days. One of the remaining days occurred in 1933 and the other in 1987.

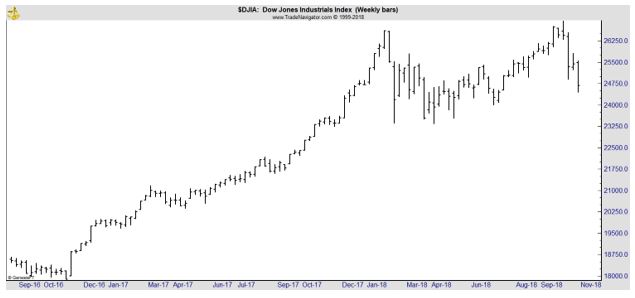
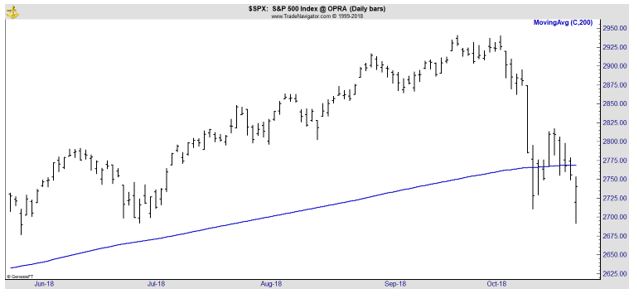
When stocks crashed in 1987, the Dow was already below its 200 day moving average (MA).

Dow in 1987

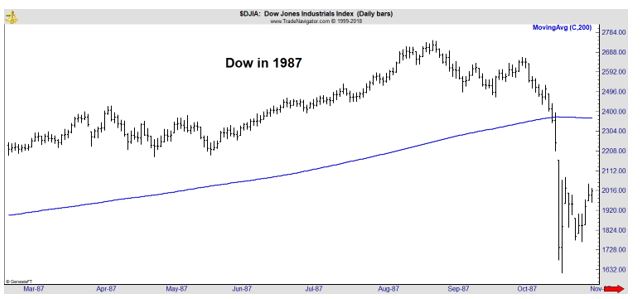
That means the Dow was trading below its 200-day MA on nine of the ten biggest days. That is an important point to consider.

Specifically, missing the ten best days in the stock market would have meant missing out on bear market rallies. That’s a fact that is often left out and bears repeating – nine of the ten best days in the stock market were short-lived bear market rallies.

What About Missing the Worst Days?

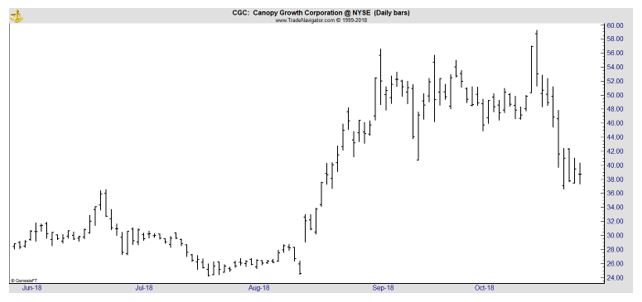
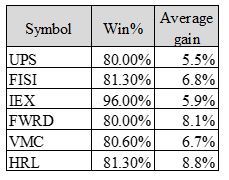
If missing the ten best days has such a large impact on returns, it seems logical to consider what would happen if an investor could miss the worst days. The results of that thought exercise are summarized in the next chart.

Compounded annual growth rate

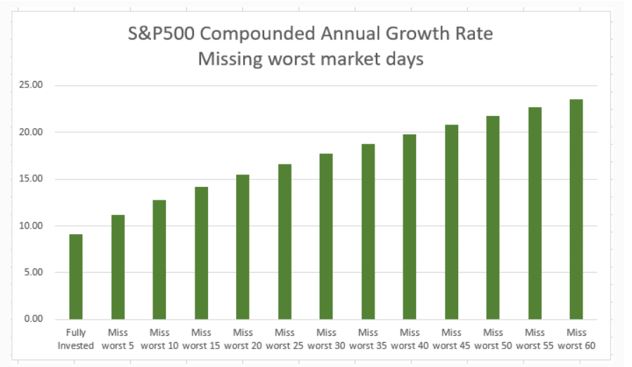
Source: AlvarezQuantTrading.com

The results are impressive. As Cesar Alvarez explained, “fully invested CAR (compounded annual return) is 9.08% vs missing the worst 60 with a CAR of 23.53%. MDD (maximum draw down) goes from 55.25% to 31.89%.”

In other words, missing the worst days has a more significant impact on performance than being invested for the best days or than being a buy and hold investor.

But, Alvarez reaches the right conclusion about this exercise:

“At the end of the day both ideas should be dropped. They show you the obvious. You would be crazy to try and time the market on a day by day basis. These best and worst days also tend to bunch up, which makes it even harder.”

Prepare for the Worst and the Best

There is certainly something appealing about missing the worst days in the stock market. Just like there is something alarming about missing the best days. But, neither feat can be achieved. However, the lesson is not that an investor should simply buy and hold.

The best days come in bear markets. That’s because volatility is high when markets are falling. Missing the bear market completely would mean missing the best and the worst days and that would mean attaining performance that is lower than a buy and hold investment.

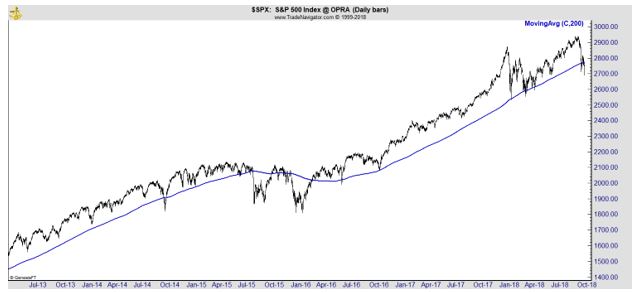
However, simply sitting out the market when prices are below the 200 day MA would allow an investor to avoid large losses. And that could allow an investor to retire on time. After all, the goal of an investor is not simply to be invested. The goal is to meet some personal objective such as funding college or retiring comfortably.

Understanding that goal, the investor should develop a strategy. If the strategy is to have funds available at a certain time, such as the time a child graduates high school, then the strategy should focus on avoiding risk.

Avoiding risk should be the primary objective of any investor. A strategy, something as simple as using a monthly MACD indicator, could help an investor meet their goal. And, that is the objective even if it means missing the best days since that will almost guarantee missing some of the worst days.

This is not what an investor hears from financial planners. But, planners are working for annual fees in many cases and won’t be paid for holding cash. They should be used when appropriate but investors need to ignore the “ten best days’ trick and ensure their money is working towards a goal.


Uncategorized

Prohibition Is Over: How Marijuana Differs from Alcohol

pot stocks

Prohibition in the United States was a nationwide constitutional ban on the production, importation, transportation, and sale of alcoholic beverages from 1920 to 1933.

Many communities in the late-nineteenth and early-twentieth centuries introduced alcohol prohibition, with the subsequent enforcement in law becoming a hotly debated issue. Prohibition supporters, called “drys”, presented it as a victory for public morals and health.

Finally, the entire nation became dry under the Eighteenth Amendment to the United States Constitution in 1920. Enabling legislation, known as the Volstead Act, set down the rules for enforcing the federal ban and defined the types of alcoholic beverages that were prohibited.

For example, religious use of wine was allowed. Private ownership and consumption of alcohol were not made illegal under federal law, but local laws were stricter in many areas, with some states banning possession outright.

But, alcohol never fully went away. Criminal gangs were able to gain control of the beer and liquor supply for many cities. This led to “wets” arguing that prohibition was responsible for causing crime, and lowering local revenues.

Prohibition ended with the ratification of the Twenty-first Amendment, which repealed the Eighteenth Amendment on December 5, 1933. Some states continued statewide prohibition, marking one of the last stages of the Progressive Era.

You might be asking what this has to do with investing? Well, the prohibition of marijuana is ending and studying history could help investors prepare for what comes next.

Prohibition Ends, Again

Barron’s recently noted that “Marijuana is now legal in Canada and cannabis stocks have a combined market capitalization of $27.4 billion. That number was $9.2 billion at the start of the year…

But now what? …the larger North American Marijuana Index is down 21% since hitting a 52-week high just a week ago, on Oct. 16. Should investors jump in now that the sector is in bear-market territory?

There might be only one market precedent for the rapid legalization of a formerly controlled, mind-altering substance: The end of Prohibition.”

The author then looks back, describing how companies that made distilled alcohol fared after the end of prohibition.

distiller stock prices

Source: Barron’s

This chart shows, “The distiller stocks peaked in July 1933, and shortly after that The Wall Street Journal’s Pure Gossip column opined that many felt the stocks had gone ahead at too rapid a pace.

Unfortunately for anyone hoping to jump on the pot stocks bandwagon, booze stocks languished into 1934. You had to be early to ride the post-Prohibition trade. However, company profits and company stock prices diverged. The end of Prohibition was good for bottom lines.”

reported profits

Source: Barron’s

Anheuser-Busch was making Budweiser beer when Prohibition ended but was nit a publicly traded company until 1938 so it’s stock performance can not be considered for that time frame.

The conclusion from this research could be that stocks fall after the news and that could be the case for marijuana, but that could be the wrong lesson to draw from this research.

Reasons Marijuana Could Boom

The chart above focused on alcohol distillers. These companies make alcohol but alcohol has a number of uses. Even in prohibition, alcohol was manufactured for industrial uses and for processing other products. It’s unfair to consider alcohol and alcoholic beverages as the same thing.

The profits for Anheuser-Busch show the story of alcoholic beverage makers. There the story is as one would expect with legalization adding to the growth of profits for the company. That could be the case for marijuana companies in the current market.

The chart of stock prices also holds some important information for investors considering the marijuana sector. Seagram’s is included in the chart and this is a company that was focused on alcoholic beverages rather than alcohol.

You may be familiar with Seagram’s because the company is thriving, even today. And the chart shows that the price of Seagram’s stock rose after the repeal of Prohibition. This could be the closest company in that chart to today’s marijuana operations.

Investors in the marijuana sector will experience the ups and downs of any sector. This was true for investors in internet stocks in the late 1990s, for investors in radio stocks in the 1920s and in other new industries throughout history.

Buying the largest stocks in the industry could be one way to increase the potential for profits in the long run. Amazon.com, for example, was one of the largest companies in the 1990s and survived to deliver large gains to investors.

Among the largest companies in the growing marijuana sector is Canopy Growth Corporation (NYSE: CGC). The stock did pull back after legalization in Canada but could be preparing for another up leg.

CGC daily chart

It’s important to consider that the pull back in the marijuana industry came as the broad stock market sold off. Major market averages sold off and are more than 10% below their highs, and that loss came at the same time as marijuana legalization in Canada.

That means the selling in marijuana stocks may be unrelated to news about the industry. It could be just a normal move for a volatile sector in a bear market. It could actually be a time to buy as the sell off creates opportunities in an expanding sector.

The largest stocks are likely to be among the winners in any industry. They carry risks, but are generally less risky than smaller stocks.

It’s not surprising that analysts will draw different conclusions from history and arrive at different opinions about the prospects for marijuana stocks.

The truth is that While marijuana is likely to be a large market, there will be winners and losers and times when some companies soar while others languish. In short, it will be like other volatile sectors. But, the opportunities for gains may be larger than average in the new market that is being created.

But, marijuana is likely to make millionaires out of investors who make the right trades. We’ve put together a special report that can help you navigate this emerging market. You can access that report by clicking right here.

Uncategorized

This Looks Like the “Near Bear” Market of 2011

Officially, there hasn’t been a bear market since 2009. The S&P 500 bottomed in March of that year after falling more than 55% over the previous year. That was the last bear market, and it was the second time in the twenty first century that the index fell by more than 50%.

A bear market is officially defined as a decline of 20% or more. A correction is a decline of at least 10% but less than 20%. While we haven’t had a bear market, there have been some close calls. The chart below shows the steepest decline in the current bull market, a 19.2% drop in the Dow Jones Industrial Average.

Dow Jones Index chart

The S&P 500 did fall more than 20% over that time but the Dow is generally the official index for defining a bear market. As earnings season moves on, this current time period is showing some similarities with that time frame in 2011.

Earnings Reaction Is Negative

As The Wall Street Journal reported, “Investors are selling the shares of firms that hit quarterly earnings expectations at the highest rate since 2011, a sign of concern over how long the good times can last for American corporations.

“What’s disconcerting is that companies are reporting good earnings with good guidance and they get a little pop, but then they sell off,” said Lew Piantedosi, who leads Eaton Vance’s growth-stocks team. “It’s starting to feel like the market is pricing in a greater likelihood of a recession in 2019.”

Take Amazon, the online retailer and web-services company that on Thursday posted a firm record with a third-quarter profit of $2.88 billion. It made 11 times more in the period than it did a year earlier, but its sales fell just short of expectations. Amazon shares tumbled 7.8% Friday, far steeper than the S&P 500’s 1.7% decline. Amazon is down 18% this month.

Other firms deemed similarly disappointing despite in-line quarterly earnings include online streaming service Netflix Inc. (-5.3% after earnings) and asset manager BlackRock Inc. (-4.4% after earnings).

While these are just a few high profile examples, on average, companies beating earnings estimates are selling off, contrary to normal market behavior.

FactSet noted, “Overall, 48% of the companies in the S&P 500 have reported earnings to date for the third quarter. Of these companies, 77% have reported actual EPS above the mean EPS estimate, 8% have reported actual EPS equal to the mean EPS estimate, and 15% have reported actual EPS below the mean EPS estimate.

The percentage of companies reporting EPS above the mean EPS estimate is equal to the 1-year (77%) average but above the 5-year (71%) average.

To date, the market is punishing positive earnings surprises and negative earnings surprises more than average. Companies that have reported positive earnings surprises for Q3 2018 have seen an average price decrease of -1.5% two days before the earnings release through two days after the earnings.

This percentage decrease is well below the 5-year average price increase of +1.0% during this same window for companies reporting upside earnings surprises.

Companies that have reported negative earnings surprises for Q3 2018 have seen an average price decrease of -3.8% two days before the earnings release through two days after the earnings.

This percentage decrease is larger than the 5-year average price decrease of -2.5% during this same window for companies reporting downside earnings surprises.”

The performance of companies beating analysts’ estimates is shown in the chart below.

S&P 500 surprises

Source: FactSet

Pessimism Could Be Taking Hold

Analysts noted the market reaction to earnings could be a signal that the stock market is in trouble and investors could be increasingly pessimistic.

“Perhaps more concerning, sales growth hasn’t held up as well. About 41% of companies have posted sales that have missed analysts’ estimates, far greater than the 23% of companies that have reported weaker-than-expected earnings and on track for the highest share of misses this year, according to FactSet.”

Data suggest investors have grown increasingly pessimistic about the economic outlook.

JPMorgan Chase & Co., which models recession probabilities based on factors ranging from wages to consumer sentiment, said in October that the U.S. has a 28% chance of falling into recession in the next year. Looking at the next two years, that probability rises to around 60%.

“Earnings keep coming in phenomenally strong, but people are betting on whether that can stay,” said Craig Birk, chief investment officer at financial advisory firm Personal Capital.

In part, the bets reflect trepidation about the longevity of the economic expansion, which earlier this year became the second-longest in U.S. history.

Data [also] showed sales of new homes in the U.S. fell for the fourth month in a row in September. Major auto makers also reported steep declines in U.S. sales for September.

That is adding to the sense among investors that factors that had once given stocks a boost—such as upbeat earnings reports or economic data—are becoming less important.

This, of course, is not the first time that stock prices have fallen. In fact, this is not even the first time this year that prices have dropped suddenly.

Dow Jones weekly

At the end of January, the Dow dropped more than 12% in less than three weeks. This could, of course, just be a similar pull back. But, it also could be the beginning of the first bear market in nearly a decade.

The market’s reaction to earnings indicates that this is most likely the beginning of an extended decline, or at least a period of time when the stock market stops rising. It’s possible a market consolidation could take hold.

A consolidation occurred after the decline that unfolded earlier this week. But, that consolidation came as companies were reporting good news and telling analysts that tax reform would have a positive impact on earnings.

That’s not the case now. Analysts are now expecting earnings growth to slow after the boost that tax reform did provide.

For the current quarter, companies are reporting earnings growth of 22.5% and analysts are projecting earnings growth of 16.1% for the full year (2018). For 2019, analysts expect earnings growth to drop by half, to just 10%.

Slower growth should lead to lower market valuations and that is a sign of trouble for the stock market.

Uncategorized

The Best Trades for November

November trades

Stocks fell sharply in October but that doesn’t mean they won’t rally in November. That’s the challenge investors now face. If there’s a bear market, it can be best to avoid the stock market. But, there are always rallies within a bear market. Missing them can hurt returns.

Plus, there is always the possibility of a trend reversal. Stocks could rally sharply. That means investors should consider keeping some stocks in their portfolio at all times. But, which ones are buys?

One approach is to buy value stocks. Another approach is to focus on the short term and buy stocks with strong seasonals.

We will look at following one of the simplest seasonal trades possible. Few traders follow seasonal strategies although these strategies are often profitable. They are also relatively low risk because they limit market exposure to short periods of time.

To apply this strategy, every month, an investor would run a scan to find the stocks with the best historical performance for that month. That’s it. There aren’t any other criteria.

Our Simple Strategy That’s Beaten the Market

There is no doubt that there is a seasonal trend in the market with some months delivering gains more often than others. That can be seen in the chart below which calculates the percent of time the month is higher for the Dow Jones Industrial Average since 1900.

market beating strategy

With more than 117 years of data, there are some significant swings in winning percentage from month to month. For some reason, June and September are bearish months. December is the most bullish month of the year, a cause for hope in the current market environment.

We found a simple way to benefit from monthly tendencies in stocks. We ran this strategy on TradingTips.com in real time for all of 2017 and beat the market. With a tough market environment, it could be time to revive the strategy.

To find trades for November, we will start by looking at how stocks have performed, on average, during the month. We assumed the stock was bought at the beginning of the month and sold at the end of the month every year.

We then calculated how well that strategy would have done for every stock in the Russell 3000 index. We limited our test to stocks in the Russell 3000 because those are the most liquid stocks in the market and their liquidity might provide an options trading strategy.

Of course, it’s important to remember that instead of buying the stocks, a trader could buy a call option that expires at the end of November or later. Because these are the most liquid stocks in the market, many of them have weekly options available. That allows you to match the expiration date closely to the strategy.

Call options allow for exposure to a stock with less cash since call options often trade for less than 5% of the cost of the stock. There are risks to trading options and you should familiarize yourself with those risks before placing any options trades.

Our test required a minimum of 15 years’ worth of history. We then sorted the results based on winning percentage and set the cutoff at 80%. We eliminated stocks where the average

This month, six stocks made the list of potential buys. We don’t need to know why these stocks perform better than average in November, we are simply trying to benefit from their tendency to do so.

Implementing the Strategy

It is important to remember that each of these stocks is highlighted based solely on the seasonal trend. We have not considered the fundamentals or technical picture of any of these companies. That fact provides an opportunity for you to refine the trading strategy.

Now, it is important to remember we never know whether a trade will be a winner or loser and we never know which stocks we highlight each month will deliver the biggest gains, or which ones will be losers. That will always be true with system trading and is an example of why system traders must always take all of the system signals.

The key to a successful trading strategy is to follow it with discipline. You could consider the strategy to be the entire list of stocks that pass the screen each month or you could refine it. As we’ve noted in the past, perhaps you only want to trade two stocks on the list.

Among the many possible ways to refine the list would be to determine the price-to-sales (P/S) ratio for each stock and sort from lowest to highest so the deepest value lies at the top of the list. Then, you would buy those two. This is just one example of how that process could be implemented.

The same general idea for selecting stocks could be applied to dividend yields, earnings growth rates or even technical factors such as relative strength (RS). With RS you would most likely want to own the strongest stocks.

As an alternative, you could look at RSI, the relative strength index, and buy the stocks with the lowest value. These would be the most oversold stocks and the ones that would be expected to rebound over the next month. We are simply following all of the stocks on the list without using any other filters.

Obviously, the strategy could be expanded to buy three or more stocks. Buying just one stock on the list each month is probably not the best approach since there is no way to know which stocks will provide gains each month.

The results of our high probability trading screen for November are shown in the table below.  

strategy symbols

Any of these stocks, or call options on these stocks if available, could be considered as a trading possibility for the month of November.

It’s important to remember that in identifying these trades, we applied one of the least sophisticated seasonal strategies. We simply identified stocks that performed well in a calendar month. Even though it’s simple, it is a powerful trading strategy.


Uncategorized

The S&P 500 Gave An Important Sell Signal

trading signals

With the recent sell off, many analysts have noted that the S&P 500 dropped below its 200 day moving average (MA). This can be seen in the chart below. The blue line is the 200 day MA and the price of the S&P 500 index did fall below that line.

S&P 500 daily chart

The question for investors is how important this event is and the answer is not necessarily clear cut.

Digging Into Moving Averages

The MA was one of the first indicators technical analysts developed. They were already widely used when they were written about in the standard textbook of technical analysis, the 1948 edition of Technical Analysis of Stock Trends by Robert Edwards and John Magee.

This was the first edition of their book, which is now in its tenth edition. Edwards and Magee called MAs “automated trend lines” and described how they felt when they first saw this tool in action.

The authors were “still filled with starry eyed ignorance” and were searching for the “sure, unbeatable formula” that would allow them “apply the magic and telegraph our broker periodically from Nassau, or Tahiti…”

The automated trendline looked like their ticket to paradise but, they quickly learned that “it was too good to be true.” While they learned the MA was not all that a trader needed for success, Edwards and Magee did learn that the MA could be useful.

Traders often follow the 200 day MA to assess the direction of the long term trend. They might add the 50 day MA to their charts to track the intermediate term trend and the 20 day MA can be used to determine the short term trend of the market.

These strategies can be useful when applied to a chart, but the usefulness of MAs can be tested to determine whether or not the long trends can be traded profitly.

Putting MAs to the Test

The chart below shows the appeal of MAs in the long run.

S&P 500 daily chart

The Strategy Is Relatively Simple

Traders buy when the price crosses above the MA and sell when the price closes below the MA. The simplicity of the rules makes this strategy easy to back test with real market data.

We can look back at the last twenty years, staring in October 1993. Testing will be done on the S&P 500 ETF (NYSE: SPY) in order to include dividends in the total return.

A buy and hold investment would have led to a total return of about 288%. The buy and hold strategy suffered a loss of more than 55% in the bear market that ended in 2009.

The trader buying when SPY closes above its 200 day MA and selling when the ETF is below its 200 day MA did not do as well. This trader made 70 trades instead of the 1 trade that the buy and hold investor made. While trading costs are small, they are not zero, so trading will reduce returns somewhat.

The number of trades raises another factor, the possibility of a trader missing a signal. There were an average of a little more than 3 trades a year but the signals occur randomly. There were as many as 9 trades in one year (2000) and no trades in several years.

If a trader misses a signal, the results will differ from the results seen in the back test. The truth is that missing a signal could either hurt or improve results depending on which signal is missed.

Most trades were losing trades. In fact, just 27.5% of the trades were winners, a fairly typical win rate for an MA system.

The low win rate is caused by whipsaw trades. These are trades that last just a few days or a few weeks while prices are in a trading range. These trades can deliver a small gain or a small loss but there are so many of them that whipsaw trades are a serious drag on performance.

Ignoring the cost of commissions in our back test, the 200 day MA delivered a total return of about 135%, less than half of the gains of the buy and hold investor.

Now, the MA strategy did avoid a large part of the bear market of 2008 and 2009 and the worst drawdown was only about 22%. That lower drawdown may be the biggest advantage of the MA. It allows an investor to avoid the worst of a bear market.

The Maximum Drawdown Is A Measure Of Risk

It measures the largest loss in dollar terms. To find the maximum drawdown, the system look at the gain or loss in every trade and finds the largest series of losing trades.

In this case, the maximum drawdown was less than half the largest drawdown of the S&P 500 over that same time period. This is important but an investor must consider whether not giving up half of the gains is worth the price for reduced risk.

This test is typical of how a MA strategy performs. Win rates will typically be near 30% or so and the system will underperform the market in the long run, assuming the long run is sufficiently long.

But, the strategy does reduce risk and helps avoid the largest losses that the stock market might deliver. That highlights a possible work around solution for investors.

It could be worthwhile for an investor to reduce risk when the S&P 500 falls below its 200 day MA. But, rather than waiting for the index to rally back above that MA, the investor could enter if prices move above the 50 day MA. This would require additional rules to avoid large losses but could be the baseline for a strategy.

One of the greatest trades in history, Paul Tudor Jones, uses the 200 day MA as a filter. In an interview with Tony Robbins for the book “Money: Master the Game,” Jones said,

“My metric for everything I look at is the 200-day moving average of closing prices.  I’ve seen too many things go to zero, stocks and commodities.  The whole trick in investing is: “How do I keep from losing everything?” 

If you use the 200-day moving average rule, then you get out.  You play defense, and you get out.”

That MA kept Jones from suffering large losses in the 1987 stock market crash and could be useful for many investors as well.


Uncategorized

Five S&P 500 Stocks With the Most Downside Risk

S&P 500

The stock market is in the midst of a pull back. Formal definitions of bear market markets require waiting for major market averages to decline by at least 20% before the official status of the market can be changed.

For at least some investors, this formal definition might seem insufficient. After all, they will have lost 20% or more of their portfolio before they recognize the obvious situation which is that stocks are falling.

However, there is no way to know precisely whether stocks will rise or fall in the future. That means there is no other way to know whether or not a decline is a pull back, a correction or a bear market until the decline has reached the predefined milestones.

But, Caution May Be Advisable

Whether we are in a bear market or not, it could be prudent for investors to exercise caution. One way to do that is to be sure they are not holding the riskiest stocks.

There are a number of ways risks could be defined in the stock market. We chose a quantitative approach. We defined the riskiest stocks as those with cash flow growth that is below average, who are overvalued based on the EV/EBITDA ratio and whose stock prices have lagged the broad market over the past six months.

Before identifying stocks that are vulnerable in a bear market, let’s look at why we selected those three factors.

Cash flow is the lifeline of a company. Without sufficient cash flow a company will be unable to maintain operations. Even if cash flow supports operations, it might not be enough to allow for the company to invest in operations. Or, it might not be enough to permit management to reward share holders with dividend increases or share buy backs.

Because cash flow is so important, it can be considered the most important fundamental measure of a company.

EV/EBITDA is the enterprise value (EV) to earnings before interest, taxes, depreciation and amortization (EBITDA) ratio. It includes a great deal of information and could be among the best ways to measure value.

At least that was the conclusion the authors of an upcoming paper reached. Two researchers and money managers, Wesley Gray and Jack Vogel, will be publishing “Analyzing Valuation Measures: A Performance Horse-Race Over the Past 40 Years” in the Journal of Portfolio Management.

They have already shared their results in a book, Quantitative Value. In the book, they found that the EV/EBITDA has historically been the best performing metric and outperforms many investor favorites including the price to earnings (P/E) ratio and the price to sales (P/S) ratio.

Their study looked at the period from July 1, 1971 until December 31, 2010. Some results are summarized below.

average annual return

Digging Deeper Into Valuation

One reason the EV/EBITDA ratio may not be as popular as other tools is because it does involve more research to calculate.

The enterprise value of a company is a comprehensive measure of its market value. To calculate EV, you start with a company’s stock market capitalization (the number of shares times the market price). You then add the total amount of debt the company issued at current market value and subtract the amount of cash and cash equivalents they have on the balance sheet.

valuation

This would represent the total cost of acquiring a company since a new owner would be acquiring the debt as well as the equity. Cash is subtracted in the calculation because it could be used to, at least partially, finance the purchase.

EBITDA is found by adding the expenses associated with interest, taxes, depreciation and amortization to the amount of net income.

EBITDA shows the performance of a company independent of the performance of its decisions related to taxes and capital structure. Earnings, for example, are reduced in some companies through tax strategies or by issuing debt to fund growth. EBITDA neutralizes the effect of those actions.

This ratio is available at a number of sites, including popular research sites like Yahoo and Google.

This ratio is used in practice like any other valuation metric. Low values are generally considered to be better than higher values.

This means that if you are comparing possible investment opportunities, it can be best to consider the one with the lowest EV/EBITDA ratio as long as the opportunities are in the same industry.

Finally, we used the stock price as a filter for a company’s prospects. If the stock price fails to keep up with the market, investors has a group have a dim view of the company’s prospects. That is especially important right now as the market appears to be vulnerable to a steep sell off.

Putting It All Together

We searched for the weakest stocks in the S&P 500 Index and this screen identified five:

  • Brighthouse Financial Inc (Nasdaq: BHF)
  • E*TRADE Financial Corp (Nasdaq: ETFC)
  • Jefferies Financial Group Inc (NYSE: JEF)
  • Macerich Co (NYSE: MAC)
  • Monster Beverage Corp (Nasdaq: MNST)

One way investors can use this information is to avoid these stocks or to sell their positions in these stocks if they own them.

Another way to use this information is as a trading strategy. Investors could buy put options on these stocks to potentially benefit from declines in these companies.

A put option provides buyers the right, but not the obligation, to sell 100 shares of the stock at a predetermined price for a predetermined amount of time. The maximum loss when buying puts is the amount of money required to open the trade in a cash account.

If the stocks decline, the put options should increase in value, delivering a profit in a declining market. This could be useful to investors looking to offset losses in core holdings or seeking to profit from the market weakness.

Now is an ideal time to develop and implement bearish trading strategies. Waiting for the official beginning of the bear market will require suffering significant losses. Acting before then could create profit opportunities for investors.

Uncategorized

A New Worry for Stock Market investors: Home Prices

housing market

Traders like to say things aren’t a problem until they are. In other words, higher interest rates aren’t a problem for the stock market until they become a problem.  This idea can be seen in the chart below.

SPY weekly chart

The Federal Reserve began raising short term interest rates in December 2015. At the time, the Fed Funds rate stood at about 0%. Officials increased the rate steadily and in September the Fed set the benchmark rate at a target of 2% to 2.25%.

The chart shows that the S&P 500 rose almost continuously as the Fed raised interest rates. But, now, suddenly, rates appear to be a problem.

Rates Are Just One Negative Factor in the Housing Market

One problem with higher interest rates is the impact the rates have on mortgages and the housing market. According to Barron’s:

“To be sure, those rate hikes, plus the prospect of more to come, have rippled through all borrowing costs, including those for home mortgages, lifting the 30-year fixed rate to 4.95% in the latest week, up nearly a full percentage point from its level a year earlier.”

Higher rates could be offsetting bullish factors for the housing market. Some analysts believe that favorable demographics, with millennials starting to form new households, jobs growing strongly, and consumer confidence high, should be the formula for a housing boom.

Higher mortgage rates must be why housing starts have plateaued around a 1.2 million unit annual rate, well below the peak of previous cycles which was above 2 million units a year. This is shown in the chart below.

federal housing chart

Source: Federal Reserve

One reason for the decline in construction could be the lack of affordable homes. Affordability is a problem for many potential home owners, especially the affordability of new homes where regulations add thousands of dollars to construction costs.

Analysts cited other factors that are potentially hurting the housing market:

  • Lower real earnings than any other factor. The Atlanta Fed reports pay for prime-age employees improving, but stuck around 3.5%—only a bit more than 1% after inflation. That’s not enough for younger families, many of whom are still shouldering student loans, to carry a mortgage.
  • Tax reform is a concern for some analysts “The biggest risk that no one wants to talk about is how the tax laws changed housing affordability for so many,” said Larry Fink, chief executive of BlackRock (NYSE: BLK).

Fink believes the $10,000 annual cap on federal deductions of state and local taxes has already hit states with high income-tax rates, such as California and many in the Northeast. But houses in cities such as Miami or Dallas in the $600,00 to $700,000 range might be affected, too.

He adds that even though Florida and Texas are famously state income-tax-free, property taxes on higher-priced homes in those locales can top the $10,000 SALT deduction limit.

All of this is already showing up in price data. Price gains for existing homes are decelerating as sales slow, to a 4.2% annual rate last month, down from 5.3% a year ago. The outlook for prices is even gloomier.

In an article called, “Worst Home Price Outlook Since 2009” the Economic Cycle Research institute noted:

“ECRI’s home price downturn call is based on the growth rate of our U.S. Leading Home Price Index (USLHPI), which has now nosedived to its worst reading since 2009.

The USLHPI – which is specifically designed to predict home price cycles, spotting directional shifts well before conventional methods – is telling us that a home price downturn is much more than a possible risk.

That’s because the objective process that ECRI internally calls “three P’s” has delivered a resounding yes to the question of whether USLHPI growth is in a fresh cyclical downturn.” The index is shown in the chart below.

home price index growth

Source: ECRI

Impacts Beyond Housing

Lower home prices are expected to “dampen growth in homeowners’ spending on remodeling, to a 6.6% annual rate in the third quarter of 2019 from a projected peak of 7.7% in the current quarter,” according to a forecast from the Harvard Joint Center for Housing Studies.  

That is one factor leading analysts at Credit Suisse to downgrade shares of Home Depot and Lowe’s, with analysts noting “slowing home-price appreciation reduces the “urgency” to do home repairs and upgrades, which would likely hurt the companies’ future earnings.”

Home builders’ stocks are already down by more than 20% and that is the definition of a bear market for a sector.

“Bank of America Merrill Lynch economists essentially confirmed the message already sent by home-building and related stocks: that housing will turn from being a slight tailwind for the economy to a mild headwind.

A housing price crash is unlikely, according to Capital Economics, although the advisory firm forecasts that the widely watched Case-Shiller measure could decline in real terms next year.

That’s a far sight from robust growth that would be expected during a period of historically low unemployment and modest mortgage rates.”

It is important for investors to remember that a housing down turn preceded the stock market crash in 2008. Now, no two stock market crashes are ever exactly the same but it does seem difficult to see how stock prices could soar while home prices fall.

The problem is that the two markets are linked by what economists call the wealth effect. Soaring home prices make home owners feel wealthier and healthier consumer sentiment boosts spending which leads to higher earnings high stock prices.

That was one of the reasons we saw prices and the economy do well in the 1990s. The wealth effect was bullish then. But, the wealth effect can also be bearish. That was one of the reasons that the bear market developed in 2008.

Now, we appear to be in a time period when home prices will weigh on consumer balance sheets and sentiment. This could very well contribute to a bear market in stocks. It could also lead to lower spending as consumers watch wealth disappear and a slower economy.

Housing seems to be a leading indicator and is now forecasting a less bullish future for stocks.


Uncategorized

This Group of Stocks Could Help Income Investors Ride Out a Bear Market

bear market

As stocks sold off, almost all stocks declined. That is truly the way prices move in a sell off and almost all stocks should be expected to decline but some will decline less than others. In the recent sell off, preferred stocks sold off less than the S&P 500 index.

A preferred stock, is defined by Investopedia as, “a class of ownership in a corporation that has a higher claim on its assets and earnings than common stock.

 Preferred shares generally have a dividend that must be paid out before dividends to common shareholders, and the shares usually do not carry voting rights.

Preferred stock combines features of debt, in that it pays fixed dividends, and equity, in that it has the potential to appreciate in price. The details of each preferred stock depend on the issue.”

Investors looking at preferred stock could consider iShares U. S. Preferred Stock ETF (NYSE: PFF). PFF is the largest preferred stock ETF with assets of about $15 billion. At the recent price, the yield was about 5.7%.

PFF daily chart

The chart above shows that PFF did sell off in the recent market decline, but it fell just 4.8%, less than the 7.8% decline in the S&P 500.

Analysts Are Bullish on Preferred

Barron’s recently highlighted the fact that yields on many preferred issues have risen a half percentage point or more in the past month, as investors have sold off Treasuries.

Preferreds from bank issuers like Bank of America (NYSE: BAC) and JPMorgan Case (NYSE: JPM) are yielding close to 6%. The preferred stock of some real estate investment trusts have yields of around 7%.

These yields have caught the attention of some analysts. “We’re incredibly constructive on the market now,” says Doug Baker, head of the preferred sector group at Nuveen, which runs about $8 billion of preferred investments.

One reason for Baker’s optimism is a widening yield gap between bank preferred and Treasury securities this year even as bank credit-quality improves. Banks account for more than half the $350 billion domestic preferred market.

Credit quality is important because preferred stock is a senior form of equity and thus is more vulnerable than debt to financial stress. Companies can decide not to pay preferred dividends without the actions treated as defaults.

Because of that flexibility to skip payments, credit ratings on preferreds are usually several notches below those on bonds.

Among the specific ideas for investors interested in income are the preferred shares listed in the table below.

preferreds

Source: Barron’s

Barton’s also cited one bond in particular.

One large and unusual preferred issue is the $4 billion Wells Fargo series L. It carries a lofty dividend rate of 7.5%, trades around $1,260, a big premium to face value of $1,000, and yields about 6%.

It’s a favorite of David King, co-manager of the Columbia Flexible Capital Income fund (CFIAX). “I can see why it confuses people but it’s a better instrument to own than traditional preferred.”

This convertible issue can be called only if Wells Fargo (NYSE: WFC) common stock, now around $53, hits $156 and then at an effective 30% premium to its face value. This gives the issue considerable call protection. Bank of America has a preferred with a similar structure, its series L. 

Important Investment Considerations

Analysts generally believe preferred shares of high quality companies are safe. Even though corporations have the legal ability to skip dividends, they will rarely do so. One reason is the fact that companies generally can’t pay common stock dividends without paying preferred dividends.

There are some important tax considerations investors might need to consider. These are just general points. For specific information, before investing in these type of securities, you should consider consulting your personal tax professional.

Most preferred dividends are treated like common stock dividends and are subject to the preferential 20% top tax rate. This could be beneficial to some investors.

But, REIT preferreds don’t benefit from the preferential dividend tax rate and usually are subject to a top rate of 29.6%. Investors pay their marginal income-tax rate, but they may be able to deduct 20% of their REIT dividends from their taxes.

“Thus, only 80% of the dividends derived from a REIT are taxable,” says New York tax expert Robert Willens. “Using a maximum rate of 37%, this translates into an ‘effective’ tax rate imposed on REIT dividends of 29.6%.”

Compared to bonds, liquidity is also better with preferred since most trade on the NYSE compared with the more opaque market for corporate bonds. Many preferreds are sold at a $25 face value to appeal to retail buyers. Those aimed at institutions usually have a face value of $1,000.

Preferreds generally carry fixed dividends and no or very long maturity dates. This makes preferred equivalent to an ultralong-term bond and therefore sensitive to changes in long-term rates.

One potential problem for investors is that issuers typically can redeem, or call, preferreds five years after issuance, resulting in limited upside and considerable downside.

Risks Are Significant

Before leaving an impression that there are many upsides and limited downsides to preferred stock, it can be useful to consider how the asset class performed in 2008 and 2009, what was in effect a significant stress test for many investments.

The chart below shows the performance of PFF and is adjusted to account for dividend income since income is an important factor in this type of investment.

PFF weekly chart

PFF sold off more than 60%, after adding in the dividend income, during the bear market. This was more than the S&P 500 and was most likely due to the fact that financials account for a significant share of the funds holdings and this sector was hit especially hard in the crisis.

If financials are not sold off as steeply in the next bear market, it is possible that PFF could outperform the S&P 500 and other broad stock market benchmarks. But, the risks should not be ignored.

Another risk is the fact that higher interest rates could make preferred stock less attractive.

As always in investing, consider risks and rewards when making your decisions.

Uncategorized

Khashoggi’s Impact on Investments

Khashoggi

One of the tragic stories in the news the past few weeks has been about the Saudi journalist Jamal Khashoggi who disappeared after entering the Saudi Arabian embassy in Turkey. Since then, according The New York Times, the

“investigation, including gory descriptions of audio recordings that reveal he was killed in Tarantino-like fashion, have been leaked, drip by drip, to keep the world suspended as the mystery unfolds.

The calculated media strategy has proved remarkably effective for the government of President Recep Tayyip Erdogan, ensuring that the case remains front-page news around the world.

But it has also served a deeper agenda — to push the United States to pressure Saudi Arabia — while shielding the government behind the news media to avoid an open and potentially damaging diplomatic rupture with the Saudis.

From the start, reports of the existence of the audio recordings were brandished almost as a threat by Turkish officials and pro-government news outlets, evidently to maintain pressure on Saudi Arabia, but also on the Trump administration, to resolve the issue to Turkey’s taste.”

Why This Matters to Investors

All of this is interesting news that seems to be far from the market action. But, the Federal Reserve says it’s an important story to follow.

Reuters noted, “U.S. Federal Reserve officials are monitoring the case of missing Saudi journalist Jamal Khashoggi and the possibility that any sanctions against Saudi Arabia could disrupt oil markets,” Atlanta Fed President Raphael Bostic said.

Asked about the risks to the U.S. economic outlook at a community group lunch in Macon, Georgia, Bostic mentioned geopolitical risks generally, the Brexit talks and “the Saudi Arabian situation and the question about whether what happened to that journalist is going to lead to sanctions that could impact oil markets.”

His comments, the first by a U.S. central banker about the case, reflect how it has escalated from a diplomatic dispute between Saudi Arabia and Turkey to an international incident with the potential to roil financial markets.

Bostic singled out the possible fallout if the United States or other countries determine that top Saudi officials were behind Khashoggi’s possible murder and begin imposing penalties on Riyadh.

“We don’t know what is going to happen,” Bostic said, “but one thing we will do is monitor the economy and these developments as closely as possible.”

Oil prices have been pulling back but have been volatile in the past few months.

crude oil futures

The concern is that sanctions against Saudi Arabia could reduce supply. This is especially true since the sanctions would come at the same time that the U. S. is proposing sanctions be applied to Iran that will affect the international oil market.

Saudi Stocks Could Be Affected

The threat of international sanctions is significant. Saudi Arabia could face political and economic sanctions.

According to news reports, “Senior officials inside the State and Treasury departments are actively discussing plans to exact financial punishment on Saudi Arabia for its role in the alleged murder of journalist Jamal Khashoggi, according to three people involved in the discussions.

The measures, which may include sanctions against the kingdom’s top leaders, could come down the pipeline as early as this week, officials told The Daily Beast.

Staffers and officials, including Treasury Secretary Steve Mnuchin and Secretary of State Mike Pompeo, have met continuously over the course of the last week in an attempt to detail the possible ways the U.S. could punish the kingdom without negatively impacting the U.S.’s $110 billion Saudi arms deal.

President Donald Trump has so far resisted calls by some lawmakers to halt U.S. military aid to Saudi Arabia in light of Khashoggi’s disappearance, arguing that nixing the arms deals would hurt American jobs.”

The President’s resistance indicates sanctions may not be devastating. However, the threat of sanctions has been affecting stocks in the country. U. S. investors can access the Saudi Arabian stock market through the iShares MSCI Saudi Arabia ETF (NYSE: KSA).

KSA daily chart

The daily chart does show the pull back in the past few weeks. The longer term chart below shows the run up in prices that have occurred in KSA since the ETF began trading in 2016.

KSA weekly chart

In part, the longer term run up has been due to the fact that the Saudi market has been increasingly welcoming and attractive to international investors.

One reason is because “global index provider MSCI…signed an agreement with the Saudi Stock Exchange Co (Tadawul) to jointly launch a tradeable index later this year {2018] in a move that could spur the growth of derivatives and exchange-traded funds.

Tadawul said in a separate statement it would introduce exchange-traded derivatives in the first half of 2019.”

That decision came after a thorough review of the market.

“Saudi Arabia has undergone a remarkably rapid period of change in the past few years,” said Henry Fernandez, chairman and chief Executive Officer of MSCI.

“This joint index is possible as a result of the kingdom’s adoption of international standards and desire to create additional investment opportunities for domestic and international investors.”

Khalid al-Hussan, chief executive officer of Tadawul, said the creation of the index provided a strong foundation for the development of index futures and other exchange-traded products.

He said the introduction of derivatives in 2019 was part of Saudi Arabia’s Vision 2030 Financial Sector Development Program.

“This reflects Tadawul’s ongoing commitment to create new opportunities for investors and to increase institutional investors’ participation in the Saudi market,” Hussan said.

Saudi Arabia has launched a string of market reforms since 2015, when the Riyadh exchange opened itself to direct investment by foreign institutions and began easing restrictions on foreign ownership of companies.

The reforms have encouraged international firms such as BlackRock, Citigroup, HSBC and Ashmore to invest directly in the market.

The moves come after MSCI classified Saudi Arabian equity market as an emerging market in June, which is expected to attract billions of dollars of passive funds.

Importantly to investors, this decision is unlikely to change according to the Financial Times:

“The inclusions seem certain to go ahead. A spokesperson for FTSE Russell, which will add Saudi equities to its Emerging All Cap Index from March, to a weight of 2.88 per cent, said that in the light of the Khashoggi affair it had nothing to add to its decision, taken in March this year.

MSCI, which will add Saudi Arabia to its Emerging Markets index from May, to a weight of 2.6 per cent, declined to comment.

Those are chunky weightings. MSCI says its EM indices are used as benchmarks for $1.9tn in assets. Saudi equities, owned by few investors worldwide, stand to receive a flood of money.”

This all means now could be a time to add KSA, or call options on KSA, to your portfolio if you are an aggressive investor.


Uncategorized

Another Reason to Prepare for the Bear Market

economy

Stocks in the U. S. have been volatile lately and volatility implies an unusually large amount of downside risk. That fact alone has made some traders nervous. But, that fact has little impact on investors who are invested for the long term. They tend to focus on fundamentals. And, here too is cause for concern.

In the long run, fundamentals are an important factor in the stock market. As Warren Buffett’s teacher Bean Graham said, “in the short run, the stock market is a voting machine and in the long run the stock market is a weighing machine.”

What he meant was that the short term price moves in stocks can be emotional. That explains the past few weeks. But, that has nothing to do with the long run in Graham’s analysis. The long run trend is determined by fundamentals.

Fundamentals Point to Better Values Outside the U. S.

So far this year, U. S. stocks have been outperforming global stock markets. That, in part, has led to gains in U. S. stocks outpacing fundamentals and putting U. S. valuations higher than those in the rest of the world.

According to Business Insider, “As Bank of America Merrill Lynch’s (BAML) US Equity and Quant Strategy team notes, the divergence this year has left US stocks richly valued compared to those in other regions.”

“On earnings, the S&P 500 now trades at a 12% premium to MSCI ACWI [all country world index] ex US, a high since 2009, and trades at a premium versus each of the major global regions — Europe, Japan, and emerging markets — concurrently for the first time since 2009.”

And when it comes to book valuation, the premium attached to US stocks compared to those in other markets is now the highest level on record, hitting a multiple of 2.1 times as at the end of August.

chart of the month

Source: Business Insider

The price-to-book ratio reflects the value investors attach to a company’s equity relative to the book value of its equity, or the difference between its assets less liabilities.

This indicates investors could find better values looking at markets outside the U. S. And, this opinion could be confirmed by another potential concern about U. S. markets.

Valuations Are High While Another Concern Looms in the Distance

Elevated valuations are not a problem if growth is high. Unfortunately that may not be the case in the U. S. As Axios notes,

“The big question: Is there a “sugar rush” from the tax cuts, and if so, does it matter enough that the market and economy will tank when it wears off?”

valuations

Source: Axios

That chart shows that earnings growth is set to slow. This comes as valuations are high. But, there are two sides to slowing earnings as Axios noted:

“One camp says don’t sweat the chart. Waning influence of tax cuts won’t have a disastrous impact on companies’ earnings growth, according to recent projections by Nationwide Financial’s Mark Hackett:

“Even factoring out the contributions from lower corporate taxes and share buybacks, earnings growth would still be at a healthy rate … indicating that most earnings strength is not coming from the ‘sugar rush’ of tax reform.”

The other side: JPMorgan says in a recent note that U.S. stocks are riding a “sugar high” thanks to the tax cuts and you should sweat that chart.

Analysts there say the end of the tax-cut impact will lead to dramatic earnings declines followed by cuts to earnings guidance.

The bottom line: We’re not going to know for a while, so for now, pick a side. If you’re in the sugar-rush camp, the question is, “When will the economy and markets come down from the high?”

If you’re not, you’re hunting for data points that prove the economy’s 10-year expansion is on solid footing, with or without the boost from the tax cuts.”

What to Do Now

Of course, there is no single best answer as to what to now. U. S. stocks are likely to make a big move but the move could be up or down. Many analysts expect a down move but there could be an up move as the economy heads for another year of growth.

Many economists expect a recession in 2020. Bloomberg recently listed some of the most prominent forecasts:

  • In March, Mark Zandi, chief economist at Moody’s Analytics, said that “2020 is a real inflection point.”
  • Earlier this summer, former Federal Reserve Chairman Ben Bernanke warned that the U.S. economy may face a ‘Wile E. Coyote’ moment in 2020 as various forms of stimulus start to run out.
  • SocGen warned of recession prospects in 2020, thanks to labor market tightness, the rising cost of servicing debts, and the fiscal situation.
  • Recently, billionaire hedge fund manager Ray Dalio echoed the same idea, warning that the U.S. was about two years from a downturn, thanks to the fading effects of the Trump tax cuts.
  • JPMorgan is out with a new model today that says the next financial crisis could come in 2020. The model is built upon such factors as the length of the existing economic expansion, asset valuations, the regulatory climate, and the degree of leverage in the economy.

But, given the weight of the evidence that U. S. stocks are overvalued relative to the rest of the world, it could be best to increase exposure to foreign stock markets. This is especially true since earnings growth is slowing and that could lead to lower valuations.

European stocks have already pulled back and they could have less down side in the event of a synchronized global stock market sell off. In that scenario, dividend stocks could be safer than growth stocks since dividends can cushion down side risks.

Investors could search for the best dividend payers in Europe or could use an exchange traded fund (ETF) like ProShares MSCI Europe Dividend ETF (NYSE: EUDV).  This ETF has already pulled back.

EUDV weekly chart

It could be attractive as a way to diversify outside the United States and obtain at least some income in this economy. Investors could average into positions over several months to possibly limit down side risks and obtain a lower average cost if prices do fall.