Uncategorized

Why It Can Pay to Follow the CEO

CEO news

Many investors look at news events that seem unique and simply turn their attention to the next story. But, the seemingly unique events could provide lessons for investors. And, they could also provide profitable opportunities for investors.

A Unique Story That’s Probably Not That Unusual

Recent news reports highlighted something that happened earlier this year. The headline reminded investors of a forgotten story, “Steve Wynn Saved $900 Million With Well-Timed Sale of Casino Stake” but also includes an important lesson.

Barron’s reported, “Steve Wynn showed impeccable timing with the sale of his stake in Wynn Resorts after his resignation as CEO in the wake of sexual misconduct allegations earlier this year.

Wynn shares are down sharply since the March sales, with the result that Wynn netted about $900 million more than he would have at current market prices.

Wynn sold his entire stake in the company—12.1 million shares—in two transactions in March for a total of more than $2.1 billion, or about $177 a share.

WYNN daily chart

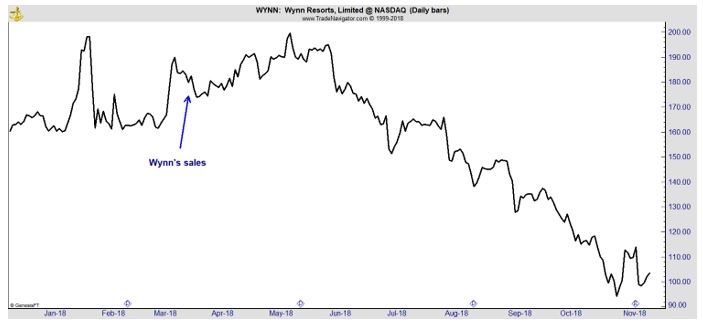
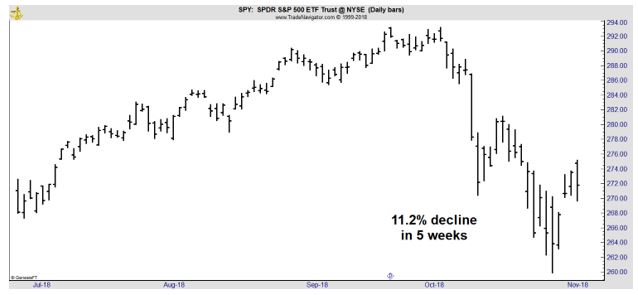
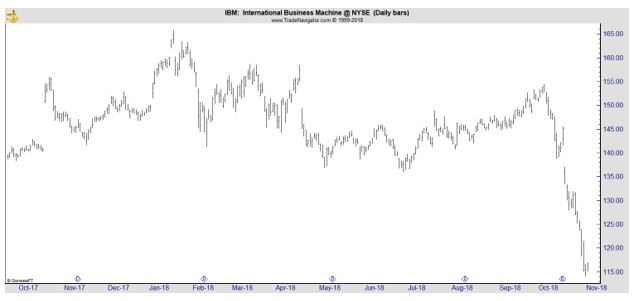
At the time, it might have appeared that WYNN was recovering as the stock marched to new highs. But, the stock then started moving steadily lower and are now about 40% below the price the former CEO received. Now, the sale of his entire stake seems to be a brilliant move.

But, was brilliance behind it? Almost certainly not. The unique reasons behind the sale were related to sexual harassment claims.

The Wynn sale included a block of eight million shares that were purchased by T. Rowe Price (three million shares) and Capital Research and Management (five million shares) at $175 a share.

Wynn, 76, was the founder and guiding force at Wynn Resorts from its initial public offering in 2002 until his resignation as CEO in February. Wynn Resorts received one of the original gambling licenses when Macau expanded casino gambling in 2002.

The company prospered as gambling boomed in the former Portuguese territory.

But then The Wall Street Journal detailed sexual misconduct allegations against him earlier this year, reporting that “Dozens of People Recount Pattern of Sexual Misconduct by Las Vegas Mogul Steve Wynn.”

At the time, he said it was “preposterous” that he would engage in such conduct. Within days, he had resigned and sold his stake in the company.

Some may assume the forced sale carried no information about the company, but that is not the case.

Wynn Was Important to the Company

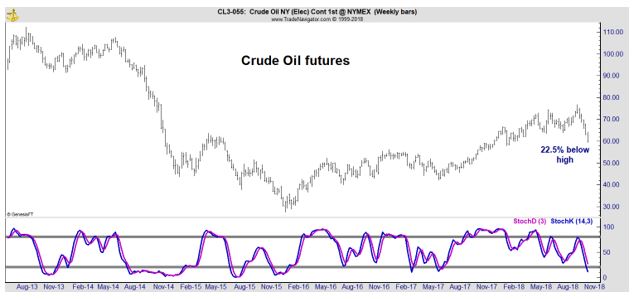
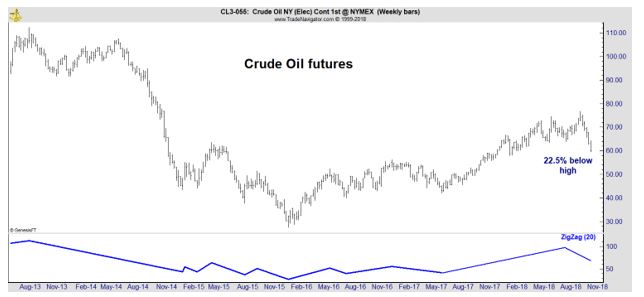
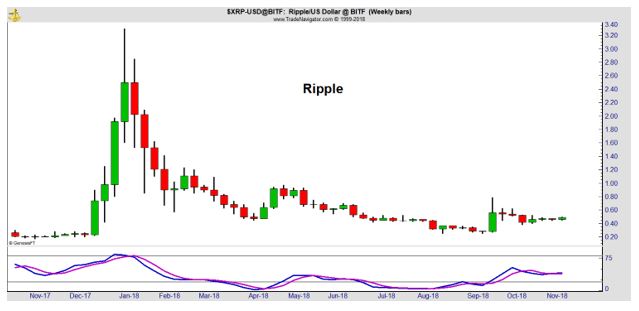
The long term stock chart shows that WYNN has always been a volatile investment.

WYNN monthly

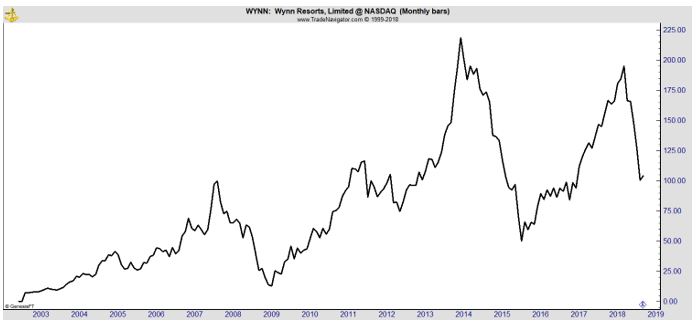
The sharp decline in 2014 coincided with concerns that the company’s investment in Macau might not pay off. It’s important for investors to remember that Wynn was involved in the decision to build there and the initial steps of the business in that country.

In many ways, Wynn was essential to the company’s success. His departure changed the company.

The Lessons for Investors

This is where the unique situation can be generalized. The departure of a CEO is often an event that changes a company. Investors should always consider the possibility that changes in important positions like Chairman or CEO, can affect a company in a bullish or bearish way.

This is also being seen in shares of General Electric (NYSE: GE). Here, a change in the CEO was initially viewed as a positive for the company but that view was quickly reversed.

GE daily

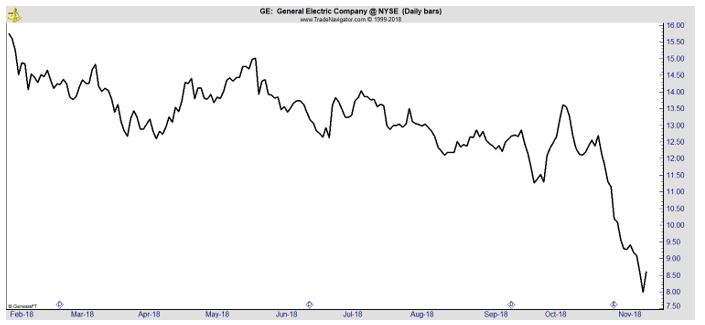
The CEO’s departure may be a positive step for the company, but it also may not be a sufficient step. New management will not always be enough to turn a company around.

Another lesson is that insider selling should never be ignored. Wynn’s selling was most likely the only case of a company founder selling such a large amount of stock in such a short amount of time. That fact might have made investors comfortable with the transaction.

But, insiders like CEOs know the company better than anyone else. In hindsight, it is reasonable to ask if Wynn understood the company faced significant challenges and he believed his departure would make it more difficult for the company to navigate those challenges.

It is important to consider the possibility that if Wynn believed the company was a great investment opportunity he would not have sold. No one required him to. He could have held the shares or put the shares into a blind trust and allowed someone else to manage them.

But, he did not do that. At the time, he appeared to be reacting to the news but now we know there may have been more to the story.

Always Pay Attention to Change In a Company

If you own shares of a company, you should always consider following a CEO. If a top manager is fired, it is possible the new team will lead a turnaround. It is also possible the new team will face significant challenges.

It could be best to consider a change at the top as a warning sign.

The same is always true of insider selling. Some relatively small or regularly scheduled selling is normal. It is unusual sales activity that should be considered. Unusual activity could be a large transaction as in the case of Steve Wynn.

Unusual activity could also simply be the selling of several insiders. It’s often said that selling can be done for any reason. Perhaps a company insider needs funds to buy a vacation home or fund a child’s education.

But, if several insiders act at the same time, the situation should be considered a warning flag. It is possible several all have the same need for cash at the same time, but is unusual.

In the stock market, success is difficult to achieve. It can be best to simply look at another possible investment opportunity when a review of one company raises a flag. There will be times when the flag is not necessarily bad.

But, with so many potential buying opportunities and with so much at stake, it could be best to consider avoiding flags whenever possible.

Uncategorized

The Next Big Thing In Investing

the next big thing in investing

Many investors spend time looking for the next big thing. The next Apple, or the next marijuana sector. They often look into the details of individual stocks but there are times when the next big thing is a change in the tax law that creates unexpected investment opportunities.

A recent article in Barron’s, “Why “Qualified Opportunity Zones” May Be the Next Hot Thing in Investing” highlighted a new type of investment that individuals should be aware of.

Defining Qualified Opportunity Funds

The tax reform law created the opportunity for investors to “roll the capital gains from the sale of anything—your home, shares of Amazon.com , a Modigliani—into a “qualified opportunity fund,” and hold for 10 years, you get to defer paying capital-gains tax until the end.

Then you’re taxed on just 85% of the original investment, and 0% on any money generated by that initial money.”

The program, which was championed by Sens. Cory Booker (D-NJ) and Tim Scott (R-SC), provides tax benefits and breaks to specifically defined census tracks, based on designations by governors.

Investors can claim breaks on capital gains taxes, depending on how long they invest in an area designated as an Opportunity Zone, and receive a deferment on taxes owed.

In particular, the exclusion of capital gains can be a “extremely meaningful investment” in both city and rural areas in need of an economic boost, according to Brett Theodos, a researcher at the Urban Institute.

The program essentially works by giving wealthy investors an incentive to target distressed areas.

investment bait

Source: The Wall Street Journal

One analyst, Lisa Knee, a lawyer and tax partner at accounting firm EisnerAmper, told Barron’s, “The reason there’s so much hype is because it’s really something new; it’s got bipartisan support, which is amazing; and if carefully structured and planned for, it could really serve a lot of greater good for the communities.”

At the highest level of description:  investor can put that money into a qualified opportunity fund—a partnership or corporation investing at least 90% of its assets in “property” in designated qualified opportunity zones.

Property can mean stock, partnership interests, or business property, like a building, which you have to have purchased after 2017, or that you substantially improve.

Say an investor sells stock today for a $1 million gain and puts it in a qualified opportunity fund. She would have nothing due now, but in 2026, she would have to pay taxes on 85% of the original $1 million. Then, if she sells the fund interest in 2028 for, say, $10 million, she would pay no taxes on the $9 million gain.

“Any gain you have during the hold period of the fund, that’s tax-free, which is pretty remarkable,” says Marla Miller, tax managing director in BDO’s National Tax Office. “The 10-year hold is very enticing for a lot of investors.”

Finding the Next Big Opportunity

These opportunity zones exist all around the country.

opportunity zones

Source: Economic Innovation Group

The total number of qualified census tracts to more than 8,700 across all states, territories, and the District of Columbia.

Now, the Economic Innovation Group, a think tank founded by Napster’s Sean Parker, estimates that there are $6 trillion of capital gains.

“You’re enticing a lot of money off the sidelines into opportunity zone areas,” says Neal Wilson, a co-founder of EJF Capital, a $10 billion asset manager. “If you can realize some of those gains; if even a small percentage of that goes into opportunity zones, it will have an impact.”

There are already a few funds available to investors. RXR Realty is exploring raising money, and EJF Capital is looking to raise $500 million for an opportunity zone strategy, according to people familiar with their strategies.

There is also interest among venture capitalists including AOLF Founder Stephen Case’s Revolution, along with Hypothesis Ventures and Mucker Capital.

But there are concerns that venture capital may not work. “Depending on how many hoops there are to jump through, it just may not be practicable for venture investments the way it will be for real estate investments,” Mucker’s Erik Rannala says.

Of course, the tax benefits are important to consider and there are strict rules related to those.

Effectively all of the use of the property has to be within the zone during the holding period. And a business in a qualified zone has to derive at least 50% of its gross income from active business in a qualified opportunity zone.

And the investment cannot be in a “sin business,” like a country club or golf course, liquor store, massage parlor, racetrack, or any gambling venue. Nor can it be a facility that furthers the use of hot tubs or tanning.

A Long-Term Investment

This is not a strategy that is suitable for short-term traders. It requires a significant period of time to realize the tax benefits. The Fundrise Opportunity Fund presents the following example of how long the investment must be held:

investor's process

Source: Fundrise

Virtua Partners, is a global private equity firm specializing in commercial real estate, is also providing access to this opportunity. The firm currently sponsors a variety of investment funds and commercial real estate projects across the United States and currently have 16 million square feet of assets under management or development.

Virtua has assembled a collection of informational webinars on the topic that are available on their web site.

And that raises perhaps the most important point related to these investments. Before investing in opportunity zines, individuals should educate themselves on the investments, the firm they are working with and the potential risks of the investment.

Tax advantaged investments, can, at times, be appealing to investors. New companies offering these strategies could be taking advantage of that aspect but unable to deliver results in the long run. For that reason, it could be best to research a firm’s track record.

If a firm doesn’t have a track record of success in the investment field, that could be a warning sign that additional research is required. But, this opportunity is worth researching for many investors.


Uncategorized

Secrets of Institutional Investors: Factors

Secrets of Institutional Investors: Factors

Many ideas in the investment community start in the academic institutions where researchers attempt to unlock the mysteries of the stock market. Every year, papers are published with theories about why and how markets work.

This is almost certainly an area that many individual investors fail to make full use of. And, there’s good reasons for that.

Individual investors are often busy with full time jobs that are not in the financial services arena. They can not dedicate a great deal of time to their projects. This means they may focus their limited time on actionable information. That might include brokerage research reports and financial media news sites.

This is enough information for many investors to manage their investment accounts profitably. But, it is just one source of valuable information and it is not, all the time, the source of new ideas. Many research reports and articles about investing cover the same ground, over and over again.

Academic researchers often seek to break new ground. Their goal is not necessarily profits in the markets as much as it is to write papers that can be published and help them achieve tenure. This frees them, in some ways, to consider ideas that are outside of the mainstream.

But, the research may take time to sift through and time is a limited resource for individual investors. Typical of research is the chart shown below. It demonstrates that there is some advantage in screening for stocks with certain characteristics.

evidence of factor performance

Source: ResearchAffiliates.com

The table shows the statistical properties of stocks with varying levels of value (value compared to growth), volatility (measured with beat), momentum which defines recent performance, and profitability and return on equity which show the quality of the stocks.

This also makes academic research an important source for innovative investment ideas. In many papers, investment ideas are defined as factors.

Factors Initially Confirm What Investors Knew

One large firm, Invesco, advises investors to “think of factors as a deeper, more precise lens through which to view your investment portfolio. They’re the drivers of performance that can help explain an investment’s risk-return profile.”

They then note that value (low price to earnings (P/E) ratios, for example), size (the market cap of the company grouped from small to large), momentum (a measure of recent performance), and volatility (how the individual stock trends relative to the broad market) are among the most important factors.

These ideas are widely employed by large investors. Barron’s recently reported on the use of factors by professional investors.

Factor investing was defined as the use of stock characteristics like size or style to make investment decisions.  One way to use factors is to tilt a portfolio.

factor investing

Source: MSCI

Barron’s noted that the subject “is talked about a lot. But how popular is it really?”

They then shared results of a survey recently completed by Invesco. The firm recently surveyed more than 300 institutional and wholesale investors, including pension funds, insurance companies, private banks, and financial advisors, about how they view and use factor investing.

They found that factor strategies still represent less than 20% of their equity and fixed income allocations, according to four out of five respondents. But it’s taking funds away from both active managers and traditional market cap-weighted indexes like the S&P 500.

“From one aspect, investors are starting to understand that there are systematic drivers of excessive returns that their active managers produce, so they start to look into the same strategies at a lower cost or more transparency,” explains Vincent De Martel, strategist at Invesco.

“The other is, investors that have large assets in market-cap weighted indexes are trying to generate better performance, and they think they can do that by leaping from market cap-based to factor-based strategies.”

While there are dozens of factors, value is still the most popular factor, despite its continuous underperformance over the past decade. It’s used by eight out of 10 respondents, and the rate is even higher in the North America region.

To De Martel, that’s a good sign. “You might have all these marketing and buzz around factor investing, but investors are not swayed by that,” he told Barron’s.

“They do their own due diligence and try to gather more information. Once they’ve done that, they understand that there are periods of underperformance or outperformance, not only for value, but other factors as well. It’s very encouraging to see it as a sign of investor maturity.”

Factors Unlock New Ideas

In the survey, about 60% of respondents said they intend to increase allocations to factors over the next three years as the performance of factor strategies has been largely in line with or exceeded expectations.

“The claim of factor investing to be able to exploit market opportunities in a systematic and low cost manner has been borne out to a significant degree,” De Martel writes in the report.

Combining factors and shifting tilts could be the best strategy according to some analysts. The management firm DWS notes that different factors work well at different points in the market cycle.

factors

Source: DWS

Factor investing is not always easy to implement. There are perhaps hundreds of factors, or at least there are hundreds of papers that have been published claiming to have identified factors. Not all have been duplicated or demonstrated to hold up over time.

There are now so many factors some prominent researchers call the current state of research a “factor zoo” and additional research is being done to isolate the factors that truly boost performance or reduce risk.

Individuals may find it profitable to research factors and tilt, or overweight, their portfolio in a way that maximizes exposure to the characteristics they are most comfortable having exposure to. This could increase profits or reduce risk and both of those are important portfolio goals.

But just as it is with any other investment strategy, factor investing does not guarantee higher return or less risk. At times, exposure to factors could result in extended periods of underperformance which could include large losses.

Considering the risks, this could still be an important area of research for individual investors.


Uncategorized

What Investors Need to Know About Oil’s Bear Market

crude oil

Oil is in a bear market. That’s using the official definition of a bear market which requires a price drop of 20% from a high. This could be significant because declines in oil have been seen before several recessions.

For investors, that raises the question of whether or not oil’s decline forecasts an economic contraction. Before attempting to answer that question, it could be best to analyze the state of the current market and then review the actual price history of oil.

The Current Decline

Crude oil prices can be measured with a number of benchmarks. Shown below is a chart of crude oil futures, one of the widely accepted benchmarks based on market prices. The price is more than 20% below the most recent high and that does meet the formal definition of a bear market.

crude oil futures

At the bottom of the chart is the stochastic indicator, a popular momentum indicator. Momentum tends to oscillate between extremes, moving from oversold to overbought extremes. Oversold conditions develop when prices fall rapidly as they have recently.

We tend to see market prices move to an extreme and stay there for some time. In the current market, the price has just recently reached an oversold level. That indicates we can expect more weakness in the price of oil as the market becomes more oversold.

Another way to measure the extreme degree of bearishness in the current market is to consider the length of the current losing streak. According to MarketWatch, last week, the market recorded “its 10th consecutive decline and matching the longest skid for the contract since a similar stretch from July 18-July 31 1984, according to Dow Jones Market Data.

Bespoke Investment Group pegs the losing stretch as the longest skid since at least 1983, noting that “there has never been a streak of more than 9 straight days where crude oil traded down on the day.”

crude oil chart

Source: Bespoke via MarketWatch

Notice that there are differences in the data, with one source noting it is the longest streak and another noting that the decline ties the record for the longest streak. This highlights the issue we raised at the beginning of this article that different benchmarks are used for this market.

By any market the current market is weak. Understanding why could help assess whether weakness is likely to be pointing to a recession.

MarketWatch added that the decline is at least partly due to “rising production and a softening in U.S. oil sanctions on Iran, that included waivers for big crude importers like China, which helped to contribute to a whipsaw lower for oil prices.

Indeed, just five weeks ago, oil futures had put in their highest prices in years. Lingering concerns about the global economy and expectations for sluggish corporate earnings in the future also have added to the downbeat mood in the oil industry.”

The analysis points to the fact that no one is certain as to why the decline is occurring. History shows the decline is in fact relatively normal.

History Shows Bear Markets Are Relatively Common

The next chart shows the frequency of 20% declines in the oil market. At the bottom of the chart, the blue line reverses whenever prices move at least 20%.

crude oil weekly

The current decline marks the seventh time oil prices have fallen by at least 20% in the past five years. In other words, large swings in oil prices are relatively common.

The concern that a decline in oil prices is a signal of a impending recession results from two examples. In 1991 and in 2008, there was a decline in oil prices coincident with a slowdown in the economy. Both were unique in their circumstances.

In 1991, oil prices had been rising sharply ahead of the first Gulf War and the price of oil more than doubled in three months late in 1990 as the buildup to the war was underway. The collapse in prices was due to the fact that the war did not affect the supply of oil as much as feared.

There was a recession near the period of time but oil prices were not reflecting the economy in 1990 and 1991 as much as they were reflecting news related to the war.

In 2008, the price of oil raced higher on optimism that the economy was growing but then, the global financial crisis struck. That crisis was sudden and unprecedented. The global economy suffered its steepest decline since the Great Depression according to some analysts.

These two instances create the concern that the price of oil is linked to recessions. It could be, but oil has moved down many, many times without creating an inflation. In fact, the two oil busts that led to recessions were not caused by oil prices but were instead unique.

That leads us back to the current market. Oil prices are in a bear market and the economy does appear to be slowing. However, the decline in oil is most likely due to a mismatch between supply and demand.

Investors should not get caught up in trying to project the probable path of the stock market based on the price of oil. That relationship works at times but is rarely accurate.

Instead, investors should look at the stock market and economic news. For now, economic news is bullish and the stock market is weak. This is consistent with an impending recession.

The stock market usually peaks before the economy turns down. The decline in stocks could be pointing to an economic slowdown in the next year or so. Economic news is generally strong until the recession strikes and by then, the stock market is likely to be down significantly.

There are a number of reasons to be concerned about the stock market. However, the price decline in the oil market is not one of them. Oil and stocks tend to be less correlated than headlines would appear to indicate.

In the end, the most important lesson for investors could be to trade according to their rules and ignore the warnings of a bear market they see in headlines and on CNBC.


Uncategorized

This Sector Could Be a Big Winner

elections

The midterm election is now in the history books and the hard work of governing is about to begin. For the next two years, Democrats will control the House of Representatives while the Republicans control the Senate and White House.

This could be a set up for gridlock. That’s a period of time when little legislation of significance passes. Gridlock would reflect the vast political differences between the leaders of both parties and that could benefit some companies.

In the stock market, it’s likely that some sectors were beaten down as the election neared. Investors could consider looking for bargains in the healthcare sector.

Elections Have Consequences

Politicians understand that they should respond to the concerns of voters. That puts the healthcare sector potentially in the spotlight. HealthLeaders noted, “Healthcare was a top priority for voters as they made their way to the polls to vote on issues such as Medicaid expansion and the healthcare leaders seeking to represent them on Capitol Hill.”

MarketWatch summarized five important points about the election:

  1. The Affordable Care Act is safe: Now the conversation in Congress, so far as the Affordable Care Act is concerned, will turn to stabilizing the marketplaces for individual insurance policies. Last year, the Trump administration cut $7 billion in health-care subsidies to low-income households that were designed to offset the cost of health insurance premiums.
  2. Short-term health insurance plans’ future in doubt: …these insurance policies are likely to be the focus of Democratic ire now that they control the House, some argue. “We can expect a democratic house to attack those plans in the same way that the Republicans attacked the Affordable Care Act for the last six years,” said Scott Flanders, CEO of eHealth, an online health insurance marketplace for both traditional and short-term plans.
  3. Medicaid expansion comes to red states: Outside of the fight for control of Congress, state elections paved the way for the continued expansion of Medicaid. Voters approved ballot initiatives in three conservative-leaning states — Nebraska, Idaho and Utah — that called on state lawmakers to expand access to Medicaid.
  4. Consumers could see relief from high drug prices: Another opportunity for bipartisanship could come with drug price reform. Democrats and Republicans alike have suggested that reducing drug prices is one of their main legislative priorities in the years ahead, and President Trump has taken a renewed interest in the subject as of late.
  5. ‘Medicare for All’ debate to continue: The plan put forth by Independent Senator Bernie Sanders, who won re-election in Vermont Tuesday, would expand the Medicare program for seniors to all Americans, meaning consumers would not owe co-pays or face deductible for medical expenses. A study by a libertarian think-tank, the Mercatus Center at George Mason University, estimated the plan would cost the federal government $32.6 trillion over 10 years.

Given how likely Republicans are to oppose the plan, some worry that Democrats could stall meaningful progress on health-care reform by fixating on Medicare for All. “I understand the appeal of the sound bite Medicare for All,” Flanders said. But he sees a different outcome: “Taking no action to resolve the crisis in the individual market today.”

These all have implications for investors but one quick area to focus on is the drug companies. There are some deep bargains in that sector.

Finding Bargains

Mylan N.V. (Nasdaq: MYL) is a global pharmaceutical company. The Company develops, licenses, manufactures, markets and distributes generic, brand name and over-the-counter (OTC) products in a range of dosage forms and therapeutic categories.

The company’s Cold-EEZE family of brands includes OTC cold remedies sold as lozenges, gummies, oral sprays, caplets, QuickMelts and oral liquid dose forms in the United States. The company makes more than 7,500 products, including EpiPens.

High prices on EpiPens, auto injectors used for patients having an allergic emergency (anaphylaxis generated negative publicity which the company has worked on correcting. The product is now available at a discount to many patients and generic versions are becoming available.

But, the stock has been beaten down and now trades at less than ten time expected earnings.

MYL daily chart

Earnings are likely to be steady and the stock could continue rebounding even after its sharp bounce on the day after the election.

Allergan plc (NYSE: AGN) is a specialty pharmaceutical company.

The company’s products include Botox (botulinum toxin), Namenda (memantine), Restasis (ciclosporin), Linzess (linaclotide), Bystolic (nebivolol), Juvederm (injectable filler), Latisse (bimatoprost), Lo Loestrin Fe, Estrace (estradiol), Teflaro (ceftaroline fosamil) and Androderm (testosterone).

This stock also trades at less than ten times expected earnings.

AGN daily chart

Teva Pharmaceutical Industries Limited (NYSE: TEVA) is another pharmaceutical company that trades at less than ten times expected earnings.

The Company is engaged in developing, producing and marketing generic medicines and a portfolio of specialty medicines. The company operates through two segments: Generic medicines and Specialty medicines.

TEVA has not been beaten down as much and could be more attractive to momentum traders.

TEVA daily chart

These three stocks are among the cheapest large cap companies in the stock market All three have a history of delivering earnings and all three have prospects for continued profitability and at least steady earnings.

They could offer safety to investors based solely on their value. They could also offer up side potential as the new Congress sorts through health care.

Now, there might be no real progress on fixing any of the problems that plague the health care system. For the next two years, at least, the probability of significant legislation overhauling the system should be considered remote. Significant changes would require bipartisan compromise.

But, there is now clarity for the market that there is unlikely to be a significant change that could hurt the companies in the sector. One factor that could adversely affect stock prices is uncertainty. That factor is most likely lifted for a time as there is at least some level of certainty that there will be inaction on important matters from Washington.

That means investors could focus on value and there is some compelling value in this sector. Either of these stocks could be among the winners but there is no way to know which stocks will rise. And, even though there is value in the sector, diversification is important.

But, these ideas could be among the best trades in this sector.


Uncategorized

Could This Be the Time to Consider Bitcoin?

Bitcoin

For the past few weeks, many traders have been focused on the stock market. They are concerned about the recent pull back which pushed the S&P 500 Index down by more than 10%. The question is whether or not that was the beginning of a bear market.

Traders have also been following the fixed income markets as the Federal Reserve raises interest rates and appears to be accelerating the pace of its hikes. This has led to some increased volatility in those markets at times and that contributes to concerns about stocks.

If that’s not enough, some traders have also been forced to pay attention to the oil market as sanctions on Iran and turmoil related to international pressure on Saudi Arabia captures headlines and pushes oil prices up and down.

But, one analyst recently told MarketWatch that he believes “an early Christmas present could be unfolding for owners of digital currencies.”

Cryptos Could Be Positioned to Rally

While forgotten by some investors, cryptocurrencies like Bitcoin could be returning to the headlines. Some analysts have always believed they offered an alternative to gold as a hedge against crises and the number of potential crises appears to be rising rapidly.

MarketWatch noted, “In traditional markets, it’s very common to see a stock rally leading up to the end of the year due to the increased activity in the private sector during the holidays.

However, after a volatile October, combined with uncertainty surrounding Trump’s trade war and the Fed’s monetary policy, price action has been less than positive in the last few weeks,” wrote Mati Greenspan, senior market analyst at eToro.

“It may be too early to say this, after all we’ve only seen very moderate crypto gains this week, but it is very possible that we might see a Santa Claus rally in the crypto markets.”

The chart below shows bitcoin is near the low end of its trading range which could be attractive to value investors in the market.

bitcoin weekly chart

The stochastics indicator is shown at the bottom of the chart. This is a popular momentum indicator that could be interpreted in a number of ways. Among the most straightforward interpretations is to look for crossovers of the two lines and the most recent signal was a bullish crossover.

The Value of Techncials Could Be High In Crypto Markets

Technical analysis looks at supply and demand and does not consider fundamentals. That could make technical analysis the ideal way to analyze the market which is driven almost exclusively by supply and demand factors rather than fundamentals.

At least one study has found that technical analysis could be helpful to bitcoin traders. Andrew Detzel and several colleagues published “Bitcoin: Learning, Predictability and Profitability via Technical Analysis.” They found:

“We document that Bitcoin returns, while unpredictable by macroeconomic variables, are predictable by 1- to 20-week moving averages (MAs) of daily prices, both in- and out-of-sample.

Trading strategies based on MAs generate substantial alpha, utility and Sharpe ratios gains, and significantly reduce the severity of drawdowns relative to a buy-and-hold position in Bitcoin, which already has a Sharpe ratio of 1.8.

We explain these facts with a novel equilibrium model that demonstrates, with uncertainty about growth in fundamentals, rational learning by investors with different priors yields predictability of returns by MAs.”

This indicates traders should consider signals from popular indicators in these markets. Stochastics is similar to moving averages but provides fewer signals, making it slower and at times more likely to capture significant profits from trend reversals.

Looking Beyond Bitcoin

While bitcoin is the largest currency in the crypto market, it’s market share is just over 50%.

percentage of total market capitalization

Source: CoinMarketCap.com

This is a significant change in the nature of the crypto markets and indicates traders should look beyond bitcoin. Among the leading coins is Ripple, or XRP.

Ripple is a real-time gross settlement system, currency exchange and remittance network created by Ripple Labs Inc., a US-based technology company. Ripple was released in 2012, and was designed to enable “secure, instantly and nearly free global financial transactions of any size with no chargebacks.”

It is built upon a distributed open source internet protocol, and supports tokens representing fiat currency, cryptocurrency, commodities, or other units of value such as frequent flier miles or mobile minutes.

XRP is the native currency of the Ripple network. XRP are currently divisible to 6 decimal places, and the smallest unit is called a drop with 1 million drops equaling 1 XRP. There were 100 billion XRP created at Ripple’s inception, with no more allowed to be created according to the protocol’s rules.

That means the system was designed so XRP is an asset with decreasing available supply. Not dependent on any third party for redemption, XRP is the only currency in the Ripple network that does not entail counterparty risk, and it is the only native digital asset.

XRP and Ethereum are the two largest currencies after bitcoin. The chart of Ripple is shown below.

Ripple chart

The pattern is similar to the one seen for bitcoin. The price soared and then tumbled and has moved sideways for most of the year. Stochastics is on a buy signal and has shown a series of rising bottoms. This could be considered a bullish divergence.

Technical analysts believe momentum leads price which means that the higher lows seen in the stochastics indicator should be followed by higher lows in price and that is the definition of an up trend. A  bullish divergence occurs when the indicator develops an up trend before the price reverses to an up trend.

Of course, none of this is foolproof and the crypto market remains speculative. However, this market could be suitable for aggressive traders. The charts tell a consistent story that major currencies are on buy signals and that traders should look beyond bitcoin to find other trades.

Cryptos could be an alternative to gold as a hedge against a potential crisis and a potential crisis could increase demand for major currencies. With so many crisis and other reasons to consider buying, cryptos could be worth a look.


Uncategorized

China’s Secret Could Make the Next Recession Deeper Than Expected

China’s Secret Could Make the Next Recession Deeper

Debt makes recessions worse and recoveries more difficult. This was one of the conclusions emphasized in “This Time Is Different: Eight Centuries of Financial Folly,” a book by the well respected economists Carmen Reinhart and Kenneth Rogoff.

The economists noted, “drawing on data from 44 countries over 200 years, was that in both rich and developing countries, high levels of government debt — specifically, gross public debt equaling 90 percent or more of the nation’s annual economic output — was associated with notably lower rates of growth.”

Over the 800 years of study, these episodes were relatively rare:

“There were just 26 cases where the ratio of debt to G.D.P. exceeded 90 percent for five years or more; the average high-debt spell was 23 years. In 23 of the 26 cases, average growth was slower during the high-debt period than in periods of lower debt levels.

Indeed, economies grew at an average annual rate of roughly 3.5 percent, when the ratio was under 90 percent, but at only a 2.3 percent rate, on average, at higher relative debt levels.”

But, unless this time is different, and the book argues that this time is never different, the next recession will be relatively deep.

Why This Time Isn’t Different

The authors explained the reason for the title of their book in a National Bureau of Economic Research paper they published earlier:

“Major default episodes are typically spaced some years (or decades) apart, creating an illusion that “this time is different” among policymakers and investors.

A recent example of the “this time is different” syndrome is the false belief that domestic debt is a novel feature of the modern financial landscape. We also confirm that crises frequently emanate from the financial centers with transmission through interest rate shocks and commodity price collapses.

Thus, the recent US sub-prime financial crisis is hardly unique. Our data also documents other crises that often accompany default: including inflation, exchange rate crashes, banking crises, and currency debasements.”

That paper shows a cycle in defaults, an indication of excessive debt.

percent of countries in default

Source: NBER

We could be facing another crisis.

Debt Is High, And May Be Even Higher

The International Monetary Fund noted earlier this year that, “Global debt hit a new record high of $164 trillion in 2016, the equivalent of 225 percent of global GDP.

 Both private and public debt have surged over the past decade. High debt makes government’s financing vulnerable to sudden changes in market sentiment. It also limits a government’s ability to provide support to the economy in the event of a downturn or a financial crisis.”

global debt

Source: IMF

The increase is broad based, “Debt-to-GDP ratios in advanced economies are at levels not seen since World War II. Public debt ratios have been increasing persistently over the past fifty years.

In emerging market economies, public debt is at levels seen only during the 1980s’ debt crisis. For low-income developing countries, average public debt-to-GDP ratios are well below historic peaks, but it is important to recall that debt reduction from earlier peaks involved debt forgiveness.

Moreover, low-income developing countries’ debt climbed 13 percentage points in the last five years.”

This, in itself, would be a cause for concern. But, the real amount of debt could be even larger.

Carmen Reinhart, the expert on debt in the long run, recently noted hidden debt from China that appears to be missing from official numbers.

“Over the past 15 years, China has fueled one of the most dramatic and geographically far-reaching surges in official peacetime lending in history.

 More than one hundred predominantly low-income countries have taken out Chinese loans to finance infrastructure projects, expand their productive capacity in mining or other primary commodities, or support government spending in general.

But the size of this lending wave is not its most distinctive feature. What is truly remarkable is how little anyone other than the immediate players – the Chinese government and development agencies that do the lending and the governments and state-owned enterprises that do the borrowing – knows about it.

There is some information about the size and timing of Chinese loans from the financial press and a variety of private and academic sources; but information about loans’ terms and conditions is scarce to nonexistent.

Three years ago, writing about “hidden debts” to China and focusing on the largest borrowers in Latin America (Venezuela and Ecuador), I noted with concern that standard data sources do not capture the marked expansion of China’s financial transactions with the remainder of the developing world.

Not much has changed since then. While China in 2016 joined the ranks of countries reporting to the Bank for International Settlements, the lending from development banks in China is not broken down by counterparty in the BIS data.

Emerging-market borrowing from China is seldom in the form of securities issued in international capital markets, so it also does not appear in databases at the World Bank and elsewhere.

These accounting deficiencies mean that many developing and emerging-market countries’ external debts are currently underestimated in varying degrees.

Moreover, because these are mostly dollar debts, missing the China connection leads to underestimating balance sheets’ vulnerability to currency risk. While the amounts involved may be modest from the standpoint of China, the magnitude of the understatement (as a share of the recipient countries’ GDP) across all the borrowers is about 15%.”

In other words,  there appears to be a problem according to the official data but the official data likely understates the magnitude of the problem.

What This Means to Investors

All of this is important because it requires a longer than average time for markets to recover from declines that occur when government debt is high.

prices

Source: Reinhart and Rogoff, 2011

The table above shows averages and covers markets in a number of countries over a number of centuries. Many may dismiss the data as irrelevant since, as the saying goes, this time is different. That could be a mistake. The next chart summarizes the 2008 crisis in the U. S.

2008 summary

Results are very much in line with the averages. And, recovery takes years so investors should consider this information when making decisions. Now might not be the best time to make significant financial investments.


Uncategorized

Buybacks Are Now Important to the Bull Market

In the recent market sell off, some analysts wondered if the lack of corporate buybacks was a problem for the market. Buybacks have been a primary factor driving the bull market in the opinion of some analysts.

That opinion is based on charts like the one below.

buybacks relative to market cap

Source: MarketWatch

This chart shows that companies have bought back $4.5 trillion worth of stock and the belief is the buy backs drive prices higher.

But, companies are not allowed to buy during earnings season.

Many companies have put in place blackout periods that limit trading in shares from a few weeks before earnings are released until shortly after, sometimes just 48 hours after results are announced.

Buy Backs Should Pick Up

Now, with about three quarters of companies releasing earnings, buy backs are expected to pick back up. That should support higher prices in the stock market.

The view of analysts at JPMorgan is an example of the bullish argument.

“With the largest one-way buyer returning in size to the market post earnings, we expect liquidity to improve and equities to move higher,” wrote equity strategists led by Dubravko Lakos-Bujas, in a research note, referring to buybacks.

The report included the chart below which shows when companies are exiting their blackout periods.

companies come out of blackout

Source: MarketWatch

The report also noted that “…the latest selloff likely hastens the process as corporates should accelerate share repurchases post earnings. We believe companies best positioned to take advantage of the selloff are those with active buyback programs and coming out of the blackout period.

As a reminder, we expected buyback activity for S&P 500 companies to be ~$800 billion this year. This estimate is likely to be conservative given better than expected earnings (25% vs. expectation of 22%), market volatility, and still elevated overseas cash of ~$1.1t – we now expect buybacks to reach $900-1,000b this year.”

Others agree with that view. Analysts at Goldman Sachs project that stock repurchases will reach $1 trillion this year, up 46% from 2017 on the back of tax reform and strong corporate cash flows.

buyback authorizations

Source: MarketWatch

“More than 80% of firms in the S&P 500 have reported results and may resume repurchasing stock on a discretionary basis after being on hiatus for the past month,” said David Kostin, chief U.S. equity strategist at Goldman Sachs, in a note released recently.

Howard Silverblatt, senior index analyst at S&P Dow Jones Indices, also noted that buybacks are occurring at a more accelerated pace.

“Buybacks are again running stronger than expected,” he said.

Second-quarter repurchases are up 57% from the same period a year earlier, with notable activity in the tech sector where buybacks surged 130% year-over-year, according to Silverblatt.

Going forward, buybacks are expected to play a critical role in supporting prices as big investors such as mutual funds and pension funds have been net sellers, Kostin said.

The Goldman strategist maintains his year-end S&P 500 forecast of 2,850 which suggests that the market is largely expected to be rangebound until the end of the year although he projected a 12-month target of 2,925.

But, the Bears Also Have a Case for Lower prices

Market bears can cite reasons for lower prices including fears that the Federal Reserve will keep raising interest rates until the economy slows and even enters recession. Global growth is also slowing. This will affect the pace of earnings growth at a time when valuations are stretched to the high side.

Goldman Sachs has mixed feelings about the pace of earnings growth. Their analyst noted:

“The rate of earnings growth has certainly peaked as the surge in profits from the initial cut in tax rate was always going to be most pronounced in 2018. And glamour ‘one decision’ stocks often disappoint investors when the lofty growth rates embedded in valuations turn out to be unachievable.

But since the start of the second-quarter earnings season, the consensus forecast for 2019 tech sector EPS has actually increased by 1%.” However, that might not be enough.

Vincent Deluard, global market strategist at INTL FCStone told MarketWatch, that “constituents of the S&P 500 index are on track to buyback 30% less in stock than they did in the second quarter, and he predicts the rate will continue to slow from here.

That means the much heralded predictions that there will be $1 trillion in stock buybacks this year “won’t even come close” to being realized, Deluard estimates.

There is a simple reason for this slowdown to continue:

Rising interest rates. Years of massive monetary stimulus meant that the dividend yield for many U.S. companies remained higher than the interest those companies had to pay on debt, making it sensible to issue new debt to buyback shares.

That all ended when the Fed started raising interest rates, and “as a result investors are no longer rewarding companies for purchasing their own stock,” according to Deluard.

That can be seen in the fact that “since the Federal Reserve began raising rates in December 16, 2015, the Invesco Buyback Achievers ETF has gained 28.09%, compared with a 33% gain for the S&P 500 index over the same period, according to FactSet.

In other wordsbuying a fund that purchases shares of companies that have consistently bought back their shares hasn’t been better than just buying the S&P 500.”

The end of this trend won’t be good for stock market valuations, said Deluard, but it will be good for American corporations, in the long run. He said close to one out of every three U.S. companies pay more in buybacks and dividends then they earn, a trend that cannot continue indefinitely.

And, many companies, like International Business Machines Corp. have been forced to abandon buyback plans that have helped prop up valuations in recent years. Since 2013, the firm has repurchased $42 billion of its own stock at an average price of $175, Deluard said.

On Tuesday, Big Blue announced a two-year suspension of its buyback program, to maintain it is a single-A credit rating. The stock is now below $120 a share.

Repurchasing shares at such inflated levels may have provided a temporary boost to stock prices, but they destroy shareholder value in the end, is the popular criticism among those who decry buybacks.

Deluard says that as the market weans itself off what has been a major source of higher support for shares, we shouldn’t expect stock valuations to surpass recent highs soon.

The INTL FCStone strategist declares that “the market top for this cycle has already passed.”

This all points to the fact that investors should be cautious and should not believe that buy backs alone will push the stock market to new highs.


Uncategorized

Investing Secrets of Bernard Baruch

Among the long forgotten Wall Street legends is Bernard Baruch.

His biography seems short, according to Wikipedia:

“Baruch became a broker and then a partner in A.A. Housman & Company. With his earnings and commissions, he bought a seat on the New York Stock Exchange for $19,000 ($552,960 in 2016 dollars).

Bernard Baruch

Source: Wikipedia, by Harris & Ewing, photographer.

There he amassed a fortune before the age of 30 by profiting from speculation in the sugar market; at that time plantations were booming in Hawaii. By 1903 Baruch had his own brokerage firm and gained the reputation of “The Lone Wolf of Wall Street” because of his refusal to join any financial house.

By 1910, he had become one of Wall Street’s best-known financiers.”

Baruch then became an adviser to Presidents and leaders around the world.  Below, he is shown with Winston Churchill.

Bernard Baruch

Source: Public Domain

He often walked or sat in Washington, D.C’s Lafayette Park and in New York City’s Central Park. It was not uncommon for him to discuss government affairs with other people while sitting on a park bench. This became his most famous characteristic.

In 1960, on his ninetieth birthday, a commemorative park bench in Lafayette Park across from the White House was dedicated to him by the Boy Scouts and he continued to advise on international affairs until his death in 1965 at the age of 94. Baruch College of City University of New York was named for him.

Baruch’s Legacy Includes His Wisdom

In addition to Baruch College and other honors, Baruch left a fount of knowledge for Wall Street speculators. His quotes include:

  • The main purpose of the stock market was to make fools of as many people as possible.

There are many variations of this quote and it is often attributed to others. But, this confirms that when it seems like every analyst and every investor is bullish, the market is likely to reverse. The same is true when the number of bears rises to an extreme level.

It is all too easy to believe the market is easy to profit from, but it is not, as Baruch knew.

  • When beggars and shoeshine boys, barbers and beauticians can tell you how to get rich it is time to remind yourself that there is no more dangerous illusion than the belief that one can get something for nothing.

Investing is hard work. It always has been and always will be. But, many investors believe it is easy to profit in the market, especially after a bull market. No matter what the market conditions, profits are only available through hard work.

  • Don’t try to buy at the bottom and sell at the top. This can’t be done – except by liars.

Here Baruch is reminding us that there is plenty of profit from the middle of the trend. This means it is okay to wait for a trend to be established before buying and it is fine to use profit targets to sell.

Charles Dow, the founder of the Dow Jones Industrial Average and The Wall Street Journal, noted that a trader could be profitable targeting the middle third of the trend. The beginning and the end of the trend are spots where risks are high.

  • Whatever men attempt, they seem driven to overdo. When hopes are soaring, I always repeat to myself that two and two still make four.

This tells us that bubbles are an unavoidable part of human nature. They will happen, but that doesn’t mean we, as investors, must participate.

  • Don’t buy too many different securities. Better to have only a few investments which can be watched.

This is often forgotten by investors especially in bubbles. They may assume if one tech stock is good, then twenty must be great. It is best to work hard and target finding only the very best stocks.

  • Always keep a good part of your capital in a cash reserve. Never invest all of your funds.

Cash is an asset that lets many investors sleep at night. It makes sense to have three or six months’ worth of living expenses as savings set aside in cash, not in the market since a crash could reduce three months of savings to less than one months of living expenses.

Piece of mind is an invaluable asset because when we have cash, we are less prone to panic in the market.

  • Learn how to take your losses quickly and cleanly. Don’t expect to be right all the time. If you have made a mistake, cut your losses as quickly as possible.

Other investors have noted that the trend is your friend and academic studies have demonstrated that trends can be persistent. That means when a stock is falling, it is likely to continue falling.

  • In the stock market one quickly learns how important it is to act swiftly.

This was on display recently when prices in the S&P 500 began falling quickly.

SPY daily chart

But, many investors ignored warning signs of the market’s decline. They were trying to sell at the top, and many have large losses now.

  • Nobody ever lost money taking a profit.

Now, it is true we all want big profits. But, the truth is taking small profits every week could be a path to riches. There really is only one Warren Buffett who created billions in wealth focusing on the long term. For many, millions in wealth would be sufficient and taking gains could help do that.

  • It is one thing to make money and another thing to keep it. In fact, making money is often easier than keeping it.

This idea ties into taking losses and avoiding adding to investments in bubbles. Shifting some profits to cash could be another strategy for keeping wealth.

  • I’m not smart. I try to observe. Millions saw the apple fall but Newton was the one who asked why.

With this, Baruch is telling us to watch the market action rather than trying to outsmart the market action.

These quotes all offer advice that is still useful today. Baruch is an investor worth studying for those interested in accumulating wealth rather than chasing bubbles and suffering large losses in bear markets.


Uncategorized

Warren Buffett Is As Good at Selling As He Is at Buying

Warren Buffett

Warren Buffett is famous for being a buy and hold investor. Buffett famously says that his favorite holding period is forever and he is conservative enough in his analysis to avoid making bad buys. But, his actions indicate he knows better than that.

Buffett will change his mind when the facts change, and he will sell stocks that need to be sold. We were reminded of this when a former Buffett holding jumped into the news.

IBM Makes a Big Move

IBM (NYSE: IBM) announced that it will pay for Red Hat (RHT) with cash and debt and suspend its share buybacks in 2020 and 2021 to help pay for it. The $190 per share price — for an equity value of $33.4 billion — represents a 63% premium to Red Hat’s closing price on the day before the deal was announced.

Barron’s notes that is an expensive deal:

“That’s an enormous premium compared with other deals this year. The average 30-day premium for all deals this year is 34%, according to Dealogic, and 37% for tech M&A. Even within the high-flying software sector, the price looks rich. Broadcom , which announced it was acquiring software company CA Technologies in July, paid a 20% premium.”

Of course, IBM is optimistic.

“IBM CEO Virginia Rometty called the company’s decision to acquire software company Red Hat for $34 billion a “game-changer” on Sunday. Whether it can actually jump-start IBM’s lagging business won’t be clear for years. But it certainly looks like a game-changer in terms of valuation. And that should worry IBM shareholders.”

The chart below shows the news did worry traders in IBM who sold the stock on the news.

IBM daily chart

It wasn’t that long ago that Buffett was among IBM’s shareholders.

When the Facts Change, Sell

Warren Buffett’s Berkshire Hathaway (NYSE: BRK.A) took a large stake in IBM several years ago. One reason that Buffett bought was because IBM was buying back its own shares and Buffett believed this would push the stock price up.

After buying the shares, ‘In his shareholder letter for 2011, Buffett discussed his rationale for buying IBM, lauding the company for its “brilliant” financial management. “The company has used debt wisely, made value-adding acquisitions almost exclusively for cash and aggressively repurchased its own stock,” Buffett wrote.

He then proceeded to give a tutorial on the magic of stock buybacks, arguing that investors should be rooting for IBM’s stock price to stay weak so that it could repurchase a greater number of shares.

“Naturally, what happens to the company’s earnings over the next five years is of enormous importance to us. Beyond that, the company will likely spend $50 billion or so in those years to repurchase shares.

Our quiz for the day: What should a long-term shareholder, such as Berkshire, cheer for during that period? I won’t keep you in suspense. We should wish for IBM’s stock price to languish throughout the five years,” Buffett wrote.

Buffett ended up being right. IBM did repurchase about $50 billion of stock in the ensuing five years. His wish for the stock to languish came true: At the end of 2016, the shares were trading at almost exactly Berkshire’s cost of around $170 a share.”

IBM weekly chart

Buffet’s sell was timely. The stock is now near the level it was at in 2009 and is more than 30% below the level that Buffett was purchasing shares at.

“Buffett realized his mistake on IBM last year when Berkshire sold out of what once was a $13.5 billion stake in IBM after holding most of that position since 2011.

Berkshire’s returns on IBM topped those on Treasury bills over that period, Berkshire told Barron’s, but that isn’t saying much given the ultralow yields on T-bills for much of that time. The appropriate benchmark for the IBM investment, the S&P 500, doubled over that span.”

The problem with Buffett’s original thesis was that as IBM’s earnings outlook dimmed in recent years, the company sharply cut back on the amount of shares it was repurchasing in the stock market.

IBM bought back $15 billion of stock in 2011, and $13.7 billion as recently as 2014. The repurchases then plunged to $4.6 billion in 2015, running at $3.5 billion in 2016, $4.3 billion in 2017, and $2.4 billion in the first three quarters of 2018.

IBM decided to suspend repurchases for two years in conjunction with its deal to buy Red Hat, a cloud-software company, for $34 billion.

As we noted, investors are concerned that IBM is paying a stiff 10 times annual revenues for Red Hat and the company will need to incur debt to complete the deal. That need to issue debt is one reason the company decided to suspend buybacks for 2020 and 2021 in order to maintain a single-A credit rating.

The deal is due to close in the second half of 2019 and the company is expected to repurchase stock until then. Just days ago, IBM authorized an additional $4 billion of share repurchases.

But, of course, there is no assurance that IBM will complete the buy back and there is no reason to believe that the buy back will lead to a large increase in the price of the stock.

Two Lessons For Investors

Buffett’s dealings in IBM highlight two important lessons for individual investors.

First is to know why you buy a stock so that you will know when it is time to sell. If your investment thesis is no longer true, it is time to sell. That’s what Buffett did with IBM and it allowed him to benefit as one analyst noted:

“Buffett turned a lemon into lemonade essentially by reallocating Berkshire’s holding in IBM into Apple (AAPL), which has been a big winner. Give Buffett credit for being willing to admit he made a mistake on IBM, something that’s not easy for investors in disappointing stocks.”

Second, if you want to copy Buffett’s style, consider buying Berkshire Hathaway.

BRK-B chart

That is the only stock guaranteed to follow the wisdom of Buffett since his investments can, and do, change.