Article

This Could Be the Best Way to Use Stock Charts

Stock charts show the price action. They simply record the history of trading and tell us nothing about the fundamentals or the financial performance of the company. Proponents of chart analysis sometimes argue the chart does incorporate the fundamental data.

They argue that the current market price reflects all of the information about the company. This is consistent with the Efficient Market Hypothesis (EMH), an academic theory that seeks to explain how stocks are priced in the market.

The theory does make some sense. When investors make a decision to buy or sell, they are acting on the information they have gathered. The current price reflects the collective decisions of millions of traders. Even a decision not to trade affects the price of a stock since that decreases the demand for the stock.

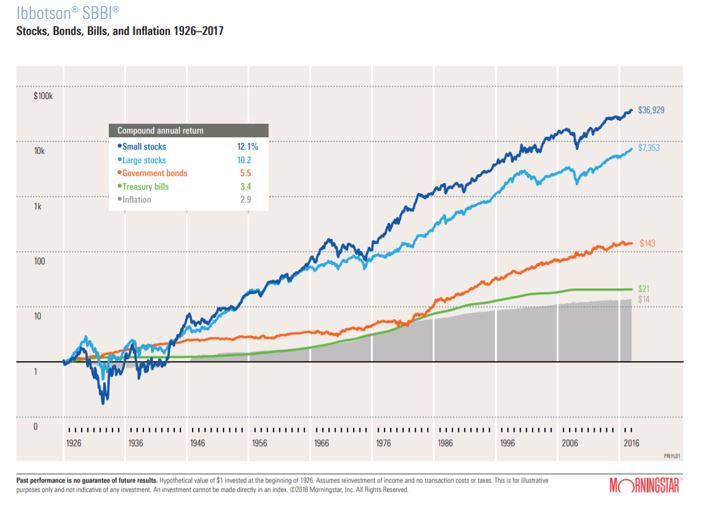
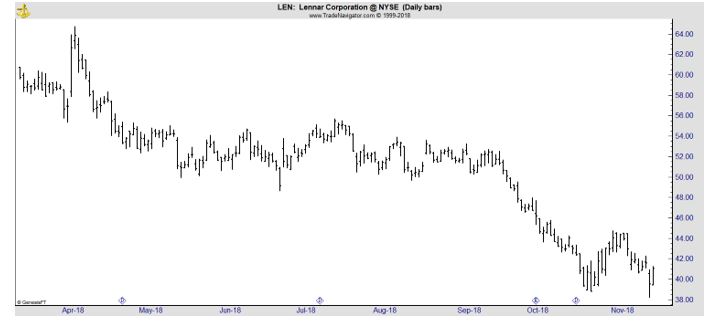
The chart presents the history of all of those individual decisions. In this way it is the running total of the collective decisions of the millions of traders. This is shown at a high level on the chart below.

QQQ weekly chart

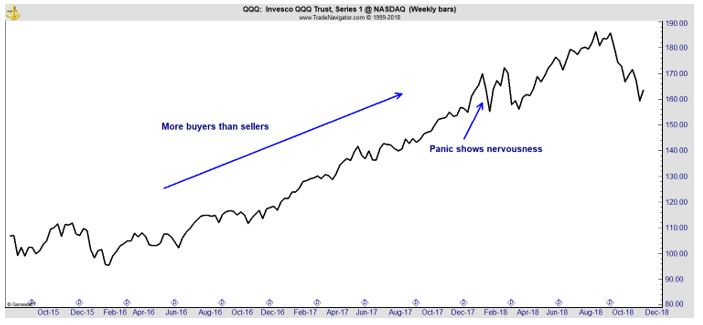
The Chart Shows Urgency of Buyers or Sellers

We know there are more buyers than sellers when prices are rising. Technically, that is not a true statement. It is more of a way to think about the market action.

Technically, each buy order must be offset by a sell order. In other words when someone enters an order to buy 75 shares of a stock, there must be an order from some other investor to sell 75 shares of that stock.

This will be true sometimes but often, market makers jump in to fill open orders.

What is a ‘Market Maker’

A market maker is a market participant or member firm of an exchange that also buys and sells securities at prices it displays in an exchange’s trading system for its own account which are called principal trades and for customer accounts which are called agency trades.

Using these systems, a market maker can enter and adjust quotes to buy or sell, enter, and execute orders, and clear those orders. Market makers exist under rules created by stock exchanges approved by a securities regulator.

In the U.S., the Securities and Exchange Commission is the main regulator of the exchanges. Market maker rights and responsibilities vary by exchange, and the market within an exchange such as equities or options.

At times, high frequency trading (HFT) firms will make the market. HFT is a program trading platform that uses powerful computers to transact a large number of orders at fractions of a second. It uses complex algorithms to analyze multiple markets and execute orders based on market conditions.

Typically, the traders with the fastest execution speeds are more profitable than traders with slower execution speeds.

Whether it’s a market maker or an HFT firm, there are firms that facilitate trading and they take the other side of orders to make trading possible. Their goal is a small profit on the trade for providing liquidity rather than taking a position designed to benefit from a price move.

Because some volume will be associated with these activities, the urgency of buyers or sellers will determine the direction of the trend. When sellers want out of positions more urgently than buyers want in to positions, they will push prices down. And, the opposite factors push prices up.

The Value of Charts

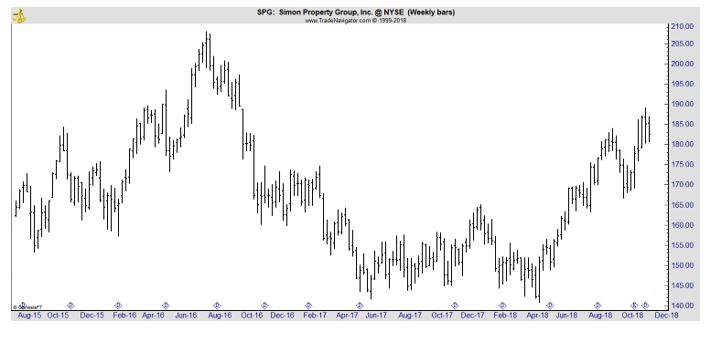
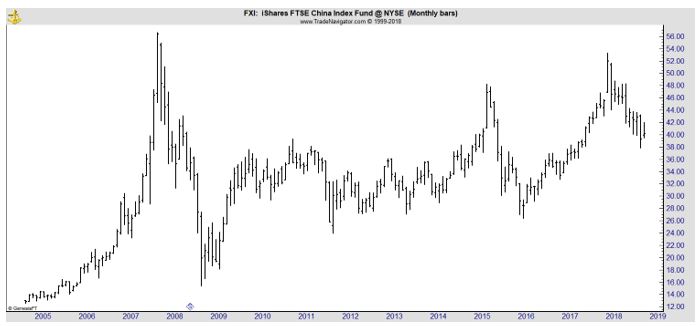
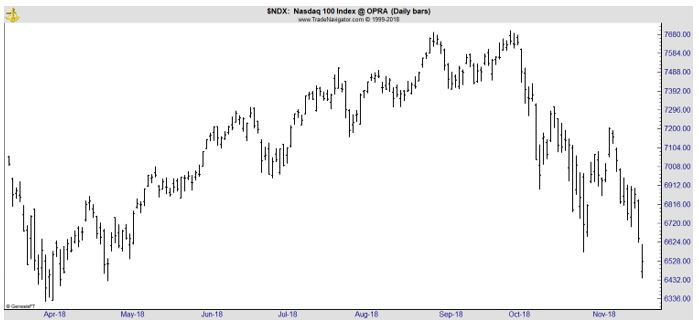
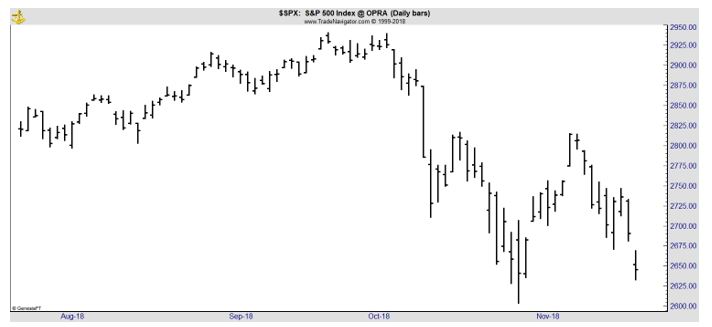
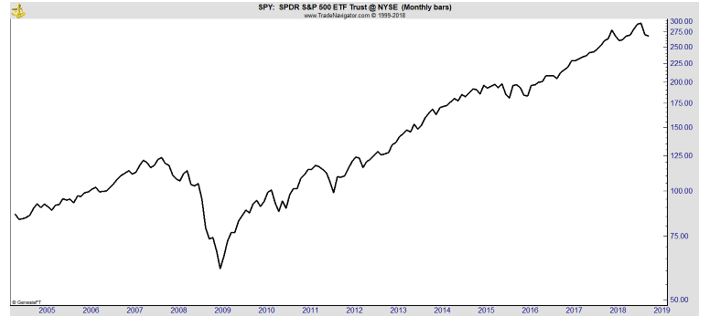
As shown in the chart above, the emotions of traders are shown in the price history. The next chart is of the SPDR S&P 500 ETF (NYSE: SPY). It’s a monthly chart and shows the long term trend.

SPY monthly chart

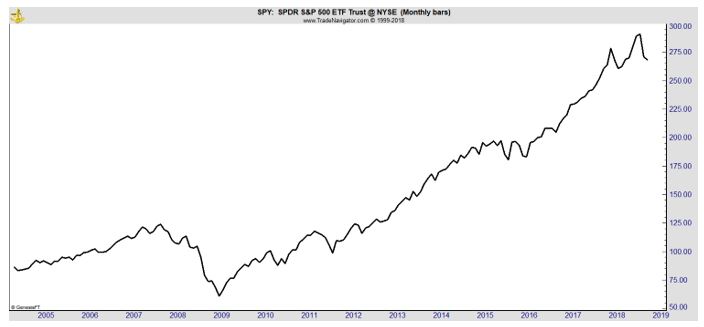
One problem with this chart is that it uses an arithmetic scale. That means the distance between prices is equally spaced. That is the distance from $10 to $20 is equal and the distance between $10 and $110 is ten times greater than that distance from $10 to $20.

This type of scaling minimizes the appearance of decline on long term charts. To avoid that problem, a logarithmic scale should be used when viewing charts of monthly data. This is shown in the next chart.

SPY monthly chart

Now, the distance between percentage changes is equalized so the distance from $10 to $20, a 100% change, is the same as the distance between $20 and $40 or $50 and $100. With this view, the bear market of 2008 looks as devastating as it was.

While the scaling can be difficult to understand, it is important to consider. The log scale shows that price declines since the bear market ended in March 2009 have been shallow. The panicky selling of the past few months is still visible and should not be ignored.

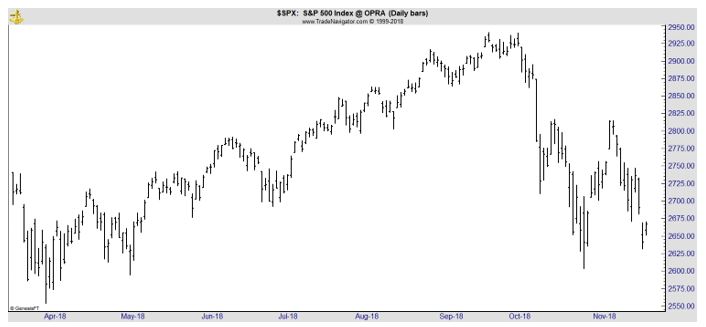
When looking at a chart, it is important to remember that when buyers are acting with urgency, prices rise. When sellers are acting with greater urgency, prices fall. And, when the sellers and buyers are about equally motivated prices move sideways.

That’s where we seem to be now from a long term perspective. The chart above shows how selling gave way to buying pressure in 2009. Since then, there have been few down moves. The decline in 2011 is instructive to consider.

At that time, it appeared stocks were falling. But, then prices reached a new high. The new high was bullish. That could be the signal to watch for now. Until prices reach new highs, the chart shows buyers are not acting with a sense of urgency.

If prices drop much more, falling perhaps 15% to 20% below their all time highs, a selling panic could develop. Investors often sell when they lose 20% and that threshold is within reach on the charts. That could send price much lower and down moves do tend to be quick, and steep,

When looking at charts, it could be best to take a long term perspective and to use a log scale to put the price action into perspective. Unfortunately, right now, that view is not what many investors want to see. It is time for caution in the markets.


Uncategorized

This Year Is Different: It’s Worse Than Many Investors Realize

Many investors believe diversification can help them reduce risks. This phrase, “reduce risks,” does have many possible meanings. But, for many investors reducing risk means minimizing losses. That’s why they trade off higher returns for reduced volatility.

Morningstar, a research firm known for their detailed analysis of mutual funds, explains,

“”Don’t put all your eggs in one basket” is a common expression that most people have heard in their lifetime. It means don’t risk losing everything by putting all your hard work or money into any one place.

To practice this in the context of investing means diversification—the strategy of holding more than one type of investment, such as stocks, bonds, or cash, in a portfolio to reduce the risk.

In addition, an investor can diversify among their stock holdings by buying a combination of large, small, or international stocks, and among their bond holdings by buying short-term and long-term bonds, government bonds, or high-and low-quality bonds.

A diversification strategy reduces risk because stocks, bonds, and cash generally do not react identically in changing economic or market conditions.

Diversification does not eliminate the risk of experiencing investment losses; however, by investing in a mix of these investments, investors may be able to insulate their portfolios from major downswings in any one investment.

Over the long run, it is common for a more risky investment (such as stocks) to outperform a less risky diversified portfolio of stocks, bonds, and cash. However, one of the main advantages of diversification is reducing risk, not necessarily increasing return.

The benefits of diversification become more apparent over a shorter time period, such as the 2007–2009 banking and credit crisis. Investors who had portfolios composed only of stocks suffered large losses, while those who had bonds or cash in their portfolios experienced less severe fluctuations in value.”

For example, over the long run, studies have shown that small cap stocks are among the best performing asset classes. But that asset also has the highest degree of risk. To reduce the risk, most investors add assets besides small cap stocks to their portfolio.

The chart below highlights the data that requires the trade offs.

data that requires the trade offs

Source: Morningstar

Clearly, a 100% investment in small caps would maximize wealth. But the early years shown in that chart demonstrate the risks. A 100% allocation to small cap stocks also would have maximized the largest loss. To reduce the risk of ruin, many investors diversify.

But This Year Is Different

Diversification has worked in the past because there is no reason to expect all, or almost all assets to move in the same direction at the same time. That means lower returns and low risks. But, this year has been unusual.

An article in The Wall Street Journal recently highlighted how unusual this year is.

“Data show global stocks and bonds could both finish the year in the red for the first time in at least a quarter-century, according to BlackRock,” an investment management firm with more than $6 trillion in assets under management.

But, that’s just two asset classes.

Deutsche Bank tracks 70 different asset classes and 90% of them are posting negative total returns in dollar terms for the year through mid-November. The previous high was in 1920, when 84% of 37 asset classes were negative. Last year, just 1% of asset classes delivered negative returns.

under pressure

Source: The Wall Street Journal

That makes this year highly unusual. More asset classes are showing losses right now than they did in 1929, the year that included the stock market crash that began the Great Depression. The peak of this data series during the Great Depression was 77% in 1931.

In the most recent bear market, the devastating decline in prices investors experienced in 2008, just 68% of asset classes declined.

What This Could Mean, For Now

Traders are fond of saying that in a crash, all correlations go to 1. Correlation is a mathematical definition of the relationship between two variables. It ranges from -1 to 1 with -1 showing a perfect inverse correlation (when one asset rises the other falls) and 1 shows a perfect correlation.

By saying correlations go to 1 in a crash, traders were noting the difficulty of making money during a stock market crash. That probably comes from their experience of seeing losses in their accounts on days when the market crash.

But, in years past, there were safe havens during crashes. In October 1987, when the Dow Jones Industrial Average fell more than 20% in one day in the largest one day decline in history, bonds went up. That’s not happening this year.

In fact, since the early 1980s, bonds have often moved up when stocks fell. That was largely because we were in a secular bull market for bonds. A secular, or long term, bull market in bonds means that interest rates are generally falling. And, rates fell from the 1980s, until now.

If we are in a rising interest rate environment, we can expect more losses in bonds. That makes the next bear market in stocks potentially different than other bear markets in recent years.

This time is different in that regard and it is different because of the globalization of markets. Hedge funds and other large investors buy and sell stocks all over the world, and many individual investors have the same capability in their accounts at popular discount brokers.

More investors trade foreign exchange now and commodities. These are typically markets where large investors follow trends and down trends will potentially be fueled by these investors in the next bear markets.

This market is different because it moves faster than ever thanks to high frequency trading and it is highly leveraged, in part because of low interest rates that allowed aggressive large investors to borrow at low costs.

These changes could explain why 90% of asset classes show losses this late in the year. This is also evidence that investors must have risk management strategies beyond diversification, potentially including plans for stop losses and other tools.


Uncategorized

Retail Isn’t Dead, and Here’s a Trade for the Sector

It’s an old story by now. Retail is dead, and, at least to some degree it is because shoppers are tired of malls. No one seems to be quite sure what killed the regional mall. Maybe it was the long walk from the parking lot, or the long walk between stores. It could have been the lack of sales staff.

The basic cause, however, didn’t really matter to one of the most popular stories in the financial and general media over the past year. But the story might be a little overdone. In fact, retail might not be dead. In fact, it looked very much alive on the day after Thanksgiving.

According to The New York Times, “Retailers and analysts said Black Friday 2018 got off to a strong start — and all indications were that it finished strong, too.

“Adobe Analytics, reported that as of 8 p.m. Eastern, consumers had already spent about $4.1 billion on Black Friday — a 23 percent increase from the same period last year.”

Though the cold weather in the eastern United States may have kept some shoppers home, Mastercard SpendingPulse said that generally “online sales appear to be filling in any weather related soft spots in brick and mortar sales.” The clothing, electronics and interior furnishing sectors were seeing especially good traction, the analysis said.

The upbeat prognosis was supported, at least in part, by photos and videos posted Friday morning on Twitter, which showed long lines and bunches of bundled shoppers gathered at places including a Kohl’s in Mansfield, Mass., and the Mall of America in Bloomington, Minn.

“Stores are busy, there’s good traffic, the queues are manageable and well-staffed, and inventory levels appear to be good for the time of day too,” said Frank Layo, managing director of Kurt Salmon, which is part of Accenture Strategy. “Retailers helped themselves by starting promotions much earlier this year to spread out the holiday shopping traffic and mitigate chaos. Their efforts appear to be paying off.”

Trading the Trend

There are a number of reasons retail could prosper.

“The economy has been on good footing for the last few years” and federal income “tax breaks have flowed through to retail sales,” says D.J. Busch, a managing director at Green Street Advisors, a commercial research and advisory firm, recently told Barron’s.

Still, Busch warns that the quality and prospects of regional malls vary considerably. So, investors should do due diligence on properties these REITs own. Green Street’s concerns include the continuing onslaught from online retailers and “uncertainty about how the department store landscape is going to shake out,” he says.

Department stores, which are typically anchor tenants, historically have been growth drivers for malls, but their ranks have been thinned by bankruptcy filings, most recently by Sears Holdings, and retrenchment by Macy’s, J.C. Penney, and others. “

There is too much unproductive retail space in the U.S.,” Busch says. While the nation has 1,000 malls, he estimates that there’s enough demand to solidly support only 300.

This means that investors should be selective and Real Estate Investment Trusts (REITs) could be a way to obtain to access the sector without picking individual winners and losers.

REITs are popular income investments because tax rules require the structure to pay out at least 90% of their taxable income to shareholders.

Many regional mall REITs sport dividend yields in the mid-single digits or higher, as the accompanying table shows, and have solid economic prospects. For example, Simon Property Group (SPG) raised its earnings guidance for its current fiscal year, which ends next month.

Busch says that retail REITs “in general are going through a massive change,” partly to attract younger customers who want different facilities at malls than do older ones. That includes restaurants, movie theaters, and even bowling alleys.

He describes an industry that’s becoming increasingly bifurcated between top-notch properties that have capital to invest in growth and lower-quality ones that don’t. “Lower-quality properties are not getting better,” he says.

“High-quality properties are at least stable, if not improving.” Operators with deeper pockets are in a much stronger position. “The capital required to own and operate regional malls has gone up,” says Busch. It’s important to invest in REITs on the right side of that trend.

Finding Value in the Sector

REIT-owned regional malls’ same-store net operating income for properties open for at least one year rose 2.1%, on average, in the third quarter, their best showing in 18 months, according to the Nareit, a trade group that represents REITs of all stripes.

Calvin Schnure, senior vice president, research and economic analysis at Nareit, says that malls in which REITs invest are better positioned than those held by others. “There are more potential shoppers with more money to spend in the neighborhoods around a REIT-owned mall,” he maintains.

According to Nareit, the average household income within five miles of a REIT-owned mall is $66,148, compared with $60,877 for other malls.

And, Schnure adds, after anchor-store departures, REIT-owned malls “line up new tenants a lot faster than a mall that doesn’t have the population density and the higher incomes in the areas around it.”

Among retail REITs, Simon Property (NYSE: SPG) has returned more than 10% since the start of the year. Simon is the largest mall REIT by market capitalization and number of malls owned among the five shown in the table below.

shopping for REITS

Source: Barron’s

SPG has done well but remains well below its all time highs.

SPG chart

Investors should not extrapolate the trend from strong sales on one day. But they should consider that the death of retail is a story made for headlines. The truth is that there will likely be a shakeout in retail. There will be survivors, but they can be hard to find.

Instead of buying the stores, investors could consider the REITs that offer space to the stores. Even as some retailers meet their demise, the property owners like SPG still own assets that could be leased to new entrants to the market.

Plus, REITs offer income that could be beneficial in any market downturn.


Uncategorized

Buffett’s Putting His Money Into This Sector

Warren Buffett isn’t always right. But he is right quite often. That’s why it can be profitable for individual investors to watch what Buffett is doing with his own money. It’s also important to remember his actions are more important than his words.

That’s why we watch Buffett’s actions and they are disclosed through his company. Like other large investors Buffett’s publicly traded holdings are subject to disclosure. Large investors are required to tell us what stocks they are buying and selling every three months.

Through these publicly available filings, some of the world’s most successful investors, a list which includes Warren Buffett, share the results of their research.

We don’t know the specifics of their investment decision process, but we do see the results of the process in these disclosures and that provides us with an opportunity to benefit from the research those steep fees pay for.

Among the filings large investors must make is SEC Form 13F, more formally called the Information Required of Institutional Investment Managers Form. 13Fs must be filed once a quarter by any investment manager with at least $100 million in assets under management.

By law, 13Fs must be filed with the SEC within 45 days of the end of a quarter. For example, forms must be filed by February 15 for the quarter which ends December 31 each year. So we don’t know what Buffett is doing in real time, in all cases. But, he must usually disclose large buys and sells almost immediately.

Trends In Holding Highlight A Favored Sector

Through Berkshire Hathaway, we can see that Buffett appears to be focusing his portfolio on large U.S. banks. Filings tell us what stocks the company owns, and Buffett does have additional managers involved in the portfolio.

However, from his public comments, it appears that he is still behind major investments and is most likely approving the large moves that reflect the portfolio strategy.

In the most recent 13f, Berkshire disclosed that the company bought more than $13 billion of bank stocks in the third quarter which ended on September 30. The largest disclosed buys included a $6 billion purchase of Bank of America (NYSE: BAC) and $4 billion in JPMorgan Chase (NYSE: JPM).

Berkshire has been an investor in JPM for some time, but the addition of BAC was new. After adding BAC, Berkshire now owns significant positions in seven of the country’s top ten banks.

Buffett's financial exposure

Source: Barron’s

Some readers may be wondering which of the ten largest banks Berkshire doesn’t own. They are:

  • Citigroup (NYSE: C)
  • Morgan Stanley (NYSE: MS)
  • Capital One Financial (NYSE: COF).

These three have heavy exposure to consumer loans, especially in the form of credit cards. Buffett may be signaling he believes this is a weak sector. But, that is speculation based on the fact that he avoided these three stocks.

Analysts Agree With Buffett

Barron’s recently reviewed the financial sector and found analysts to be as bullish as Buffett appears to be.

“Buffett’s investments offer validation for what we see as the value in the group,” says Mike Mayo, a banking analyst with Wells Fargo. “Banks are less cyclical than they have been in decades and have more resilient earnings streams because of improved financial discipline and risk control.”

He sees earnings growth of 50% or more for JPMorgan and Bank of America over the next four years.

The report noted that Buffett “may see what Mayo and other bulls do: a group that has lagged behind the market despite strong earnings growth and the most generous capital returns of any major industry.

Earnings at large banks are expected to rise about 40% this year. With income rising and stock prices generally lower, bank valuations have contracted.

Large banks now have an average forward price/earnings ratio of just 10.2, against a forward P/E of 12.6 at the start of the year, based on 22 institutions covered by Barclays analyst Jason Goldberg.

“Investors can get good earnings growth and good capital returns at a discounted valuation relative to the overall market,” Goldberg says. “Just because we’re late in the cycle doesn’t mean we’re at the end of it.” He sees 9% growth in bank earnings per share in 2019.

John McDonald of Bernstein estimates that mid- and large-cap banks will return about 100% of their earnings to holders in dividends and buybacks in the year ending in June 2019, up from 60% in 2015.”

Trading Alongside Buffett

Besides owning large stakes in the seven big banks, Buffett also has a large position in American Express (NYSE: AXP) and some smaller bank positions. Altogether, Berkshire owns about $85 billion worth of financial stocks, more than 40% of Berkshire’s total equity holdings of $200 billion.

Investors could gain exposure through an exchange traded fund such as Financial Select SPDR ETF (NYSE: XLF).

XLF daily chart

The ETF sold off sharply in the recent market decline.

Or, investors could consider Buffett’s most recent addition to the portfolio, BAC.

Morgan Stanley analyst Betsy Graseck agrees with Buffett on BAC. She sees 16% growth in 2019 earnings per share and an 18% gain in 2020, driven equally by operating profits and stock buybacks. In a client note after the third-quarter report, she urged investors to “dig in.”

Like XLF, BAC has sold off in the recent market decline. The long term chart shown below indicates the stock could be near the lower end of a trading range, or at a significant top.

BAC chart

The weekly chart of BAC demonstrates the risks of the sector. There is significant downside and not everyone has the ability to sit through large declines like Buffett does. But, the financial sector is obviously one Buffett is interested in.

Investors could, of course, also invest directly in Berkshire Hathaway but that is an expensive investment. Given the risks, it could be best to put stocks like BAC on a watch list and consider buying when the market shows signs of rebounding.

Like Buffett, it is important to plan for the downturn and be positioned to benefit. He doesn’t sell everything in a bear market and individuals might not be best served by panicking. It could be best to think like Buffett and add to long term positions.

Uncategorized

Goldman Sachs Says It’s Time to Worry

Many investors worry all the time. Many analysts urge investors to worry all the time. It feels as if some analysts have been bearish since at least 1987, warning of an impending market crash like the unprecedented one that we saw in October of that year.

These analysts have been pessimistic for so long there is even a name for them. They are called perma-bears because of their permanently bearish stance. Because they are so widely quoted in the financial media, when other analysts make bearish calls, the news can be lost in the noise.

Recently Goldman Sachs announced reasons that investors should worry, and that is news that should not be ignored.

Goldman Is Important in the Markets

The firm was famously profiled by Matt Taibbi in Rolling Stone:

“The first thing you need to know about Goldman Sachs is that it’s everywhere.

The world’s most powerful investment bank is a great vampire squid wrapped around the face of humanity, relentlessly jamming its blood funnel into anything that smells like money.

In fact, the history of the recent financial crisis, which doubles as a history of the rapid decline and fall of the suddenly swindled dry American empire, reads like a Who’s Who of Goldman Sachs graduates.”

Now, we don’t need to believe that the firm is a “great vampire squid wrapped around the face of humanity” but we should understand that Goldman is everywhere and when the company’s analysts express concerns, they should be listened to.

The firm started sounding the alarm weeks ago.

CNBC reported that, “Goldman’s ‘bear market risk indicator’ signals returns will be zero the next 12 months:

Goldman Sachs’s bear market prediction tool is at an “elevated” level that has historically signaled a zero average return over the next 12 months and a “substantial” risk of drawdown.

Goldman’s bear market indicator — which takes into account the unemployment rate, manufacturing data, core inflation, the term structure of the yield curve and stock valuation based on the Shiller PE ratio — is at a rare 73 percent, its highest level since the late 1960s and early 1970s.

The indicator is “flashing red,” wrote Goldman chief global equity strategist Peter Oppenheimer.

“Historically, when the Indicator rises above 60 percent it is a good signal to investors to turn cautious, or at the very least recognize that a correction followed by a rally is more likely to be followed by a bear market than when these indicators are low.”

bear market risk indicator

Source: ZeroHedge

To arrive at the value of the indicator, Goldman aggregated these variables in a signal indicator, and took each variable and calculated its percentile relative to its history since 1948. The indicator over time is shown in the next chart.

Bull/Bear market indicator

Source: ZeroHedge

Specific News to Watch

In addition to the bear market indicator, Goldman analysts monitor a variety of other indicators and news events. The firm generates a variety of forecasts and has access to an array of data. A review of those forecasts allowed the firm to identify six specific headwinds for the stock market:

  1. S. real GDP growth slows from 2.9% in 2018 to 1.6% in 2020
  2. China’s real GDP growth slows from 6.6% in 2018 to 6.1% in 2020
  3. S&P 500 earnings growth slows from 23% in 2018 to 8% in 2019
  4. Core inflation rises from 1.9% in 2018 to 2.2% in 2019-20
  5. 10-Year U.S. Treasury Note yield hits 3.5% in second half of 2019
  6. S. unemployment rate drops to 3.2% in 2019, creating more wage pressures

A slowing U. S. economy will reduce corporate profits and the stock market is likely to decline in reaction to that.

New reports in Investopedia summarized the importance of China’s slowdown:

Because China has become the world’s second-largest economy next to the U.S., and since it is a major buyer of goods and services offered by U.S. corporations, an economic slowdown there has major negative ramifications for U.S. companies, as well as for the overall U.S. economy.

Goldman projects real, inflation-adjusted, GDP growth rates in China to remain relatively strong in 2019 and 2020, at 6.2% and 6.1%, respectively. However, this is on a decelerating path, having been 6.9% in 2016 and 6.6% in 2017.

Increasing trade tensions between the U.S. and China are a related source of concern, as China has responded to U.S. tariffs on its goods by retaliating in kind.

“A major trade war would lead to a significant reduction in growth,” Bank of America Merrill Lynch warned in a note to clients during the summer, as quoted by CNBC. “A decline in confidence and supply chain disruptions could amplify the trade shock, leading to an outright recession,” the note added.

A slower pace of growth in China would also explain the recent weakness seen in that stock market. The chart of iShares FTSE China Index Fund (NYSE: FXI) is shown below. This is a way for U. S. investors to invest in the market and FXI is trading well below its highs in its own bear market.

FXI weekly chart

Now, it is possible for U. S. stocks to rally when Chinese stocks are weak. In fact, the bull market rally in the U. S. came as stocks in China have failed to recover their bull market highs.

FXI monthly chart

But, headwinds in the Chinese economy will threaten economic growth in the U. S. and it is the concern of a recession that is causing the headwinds for stocks.

As Goldman notes, inflation and interest rates are rising as cost pressures are building for U. S. companies. Earnings growth is slowing, and it simply must slow after the sharp rise that occurred after the passage of tax reform.

This all points to a drop in investor expectations for growth and a lower valuation of the stock market, which comes with the stock market at a high level of valuation. Investors should expect a lower price to earnings (P/E) ratio and a decline in stock prices as that metric resets.

For now, caution is warranted. It could be an ideal time to take profits or to recognize losses if that is a prudent tax planning strategy. It’s likely to be a sub-par year for stocks if Goldman is right, and the firm has a reputation for being right quite often.

Uncategorized

This Could Be Your Valuable Bear Market Strategy

Some major Wall Street firms warn we are in a bear market.

Morgan Stanley thinks the bull market is already over — investors just don’t realize it yet, according to CNN.

“We are in a bear market,” Morgan Stanley equity strategist Michael Wilson declared in a report to clients on Monday.

Even though the American economy is strong, Wilson argued that the market is sniffing out a sharp deceleration in economic growth and a decline in corporate profits.

“While 2018 is clearly not a year of recession, the market is speaking loudly that bad news is coming,” according to Wilson, who has been skeptical about the market for months.

CNBC reported that Goldman Sachs’s bear market prediction tool is at an “elevated” level that has historically signaled a zero average return over the next 12 months and a “substantial” risk of drawdown.

Goldman’s bear market indicator — which takes into account the unemployment rate, manufacturing data, core inflation, the term structure of the yield curve and stock valuation based on the Shiller PE ratio — is at a rare 73 percent, its highest level since the late 1960s and early 1970s.

The indicator is “flashing red,” wrote Goldman chief global equity strategist Peter Oppenheimer.

“Historically, when the Indicator rises above 60 percent it is a good signal to investors to turn cautious, or at the very least recognize that a correction followed by a rally is more likely to be followed by a bear market than when these indicators are low.”

And, of course, the chart shows prices are falling. The S&P 500 remains more than 10% below its highs.

And, the tech heavy Nasdaq 100 Index is more than 15% below its high.

Nasdaq 100 daily chart

A Strategy for the Bear

A bear market forces an individual investor to ask, and answer, several important questions. They must decide whether they want to stay invested in stocks and risk losses. They must ask the same question for each position. And, they must consider strategies that can help meet their goals.

One strategy that could help investors in a bear market is an options strategy. Actually, there are a variety of options strategies that can help investors in a bear market. But, for some investors, options have a reputation as risky investments.

This can be true because there is an element of risk in any investment. But, the risk in options can be controlled. And, that could be of interest to investors facing uncontrollable risks in a bear market.

Among the strategies that investors can consider is the covered call, which is a popular income strategy. But they are a risky strategy and may not be the best option for many investors.

Covered calls are a strategy that involves buying and holding a stock and selling, or writing, call options on that stock. Since each options contract covers 100 shares of stock, this strategy requires owning at least 100 shares and using multiples of 100 shares when trading.

Writing a call is a strategy used to generate income. Selling the option generates immediate income from the stock. If the option expires worthless, the investor keeps the premium as the profit on the trade. The investor also collects any dividends since they own the stock.

Calls, like all options, have an expiration date and an exercise price. If the stock is trading above the exercise at expiration, the call will be exercised and the investor who wrote the contract will have to deliver the shares at the agreed upon exercise price.

When a trader writes, or sells, a call, they are obligated to sell the shares if the call option is exercised.

Let’s look at an example for a notional stock called ABC which is trading at $100 per share. The investor can buy 100 shares and then write a covered call for $3, or $300 in total income. The call might expire in 30 days and have an exercise price of $110.

If the stock is trading at $100 when the option expires, the trader keeps the premium received when the option was written and keeps the stock since it is below the exercise price of the call.

If the stock is trading at $115 when the option expires, the trader keeps the premium received when the option was written but must sell the stock at $110 per share. This generates a total return of $113 per share but misses out on the $2 per share that would be earned without the covered call.

Why Investors Use Covered Calls

This strategy works best when the stock is little changed or even falling. if there is a large up move, the strategy is not particularly useful. Continuing with the example above demonstrates why this is true.

Assume there is a buyout of the company and the stock price soars from $100 to $150 a share. Traders who sold a call with an exercise price of $110 will be obligated to sell at $110. In this case, they will not achieve the full benefit of owning the stock.

The stock could also decline sharply. Assume the company misses its earnings expectations and the stocks falls to $80 per share. The investor who wrote the covered call can still sell their stock. They will, however, simply have to consider closing the option first.

After a 20% decline, the trader who sold the call will have a loss of just 17%. The covered call will have reduced the size of the loss. It’s possible to sell the stock but the call should be closed to avoid risking exercise. This will result in extra commissions.

Investors usually consider covered call to be useful when a stock isn’t moving much or they claim it reduces the size of a loss by a small amount. These are both true but they do not really protect against large losses and they do not allow traders to reap the rewards of large gains since they give up any gains above the option exercise price.

To understand the potential rewards and risks of a covered call strategy, a payoff diagram can be useful. This is shown below.

covered call

Source: The Options Industry Council

Notice that the call reduces the downside and caps the up side. That means when stocks are falling, this strategy could be useful since it will reduce losses and the up side potential is limited in a bear market.


Uncategorized

These Four Large Cap Stocks Are Bargains Now

These Four Large Cap Stocks Are Bargains Now

Market sell offs do have a silver lining. As prices fall, valuations tend to decline in the market. As prices fall, in other words, some stocks become bargains. And, with the S&P 500 and other major market averages showing double digit declines, bargains are appearing.

daily stock chart

The question investors must answer is what is a bargain. It could be best to define that in advance and then hunt for stocks that meet that definition. Could prices be lower, later? Absolutely. But, even Warren Buffett buys early.

In November 2008, months before the market bottom in March 2009, Warren Buffett was a big buyer, in one deal, he invested $5 billion in Goldman Sachs Group. 

In exchange, Goldman gave Buffett:

  • $5 billion worth of “perpetual” preferred shares. Goldman agreed to pay a 10% dividend on those preferred shares to Buffett, which cost Goldman about $500 million a year.
  • Warrants for 43.5 million additional shares. Warrants are similar to options. In this case they were the legal right to buy a stock at a particular price, which for Buffett was $115 per share. The deadline for exercising these warrants was Oct. 1, 2013.

In the end, Buffett was rewarded for buying too soon:

  • On the preferred shares, Goldman had the right to buy them back, and did so in March 2011, paying Buffett $5.64 billion. That included the original $5 billion in principal, as well as a $500 million bonus for early repayment, and $140 million in dividends Buffett was due.

In total, Buffett made $640 million on his $5 billion investment, or about 13% in a little more than two years plus he received dividends of about $1.1 billion in that time, a total return on this half of the investments of about 35%.

  • The warrants allowed Buffett to add to his gains. This part of the investment allowed him to buy shares at $115 which he did, and he is a large shareholder of the company.

Now, of course, we aren’t Warren Buffett. But we can find value in the market.

Finding Value Like a Quant

A quantitative approach to investing relies on computers to identify characteristics of successful stocks. Based on historical performance of that factor, the investor buys all stocks that meet the defined criteria.

Quants often use a computer output to drive all decisions. They may not supplement that output with any other analysis. This has provided success and outsized returns to some investment managers.

But, for many years it required expensive data sets and customized programming skills to find stocks with a quant strategy. Now, those tools are available to individual investors and some tools for implementing quant strategies are even available for free.

A Free Quant Screening Tool

One way to find stocks meeting a variety of predefined requirement is with the free stock screening tool available at FinViz.com. At this site, you could screen for a variety of fundamental factors like free cash flow, high levels of institutional ownership and bullish institutional transactions.

There were 7,544 stocks in the database on a recent day. We want to search for just a few that could be good investments. We will focus solely on fundamentals criteria and we will search for safe income stocks. There is no guarantee these stocks will be safe but we use quant criteria in an attempt to limit risk.

To ensure the stock is tradable at a reasonable cost, even in a market crash, we will limit the search using market cap selecting just the largest stocks which is defined in FinViz as stocks with a market cap of at least $10 billion. All selections are made with pull down menus as shown below.

We then added a filter for high income (a dividend yield of at least 5%) and for safety we required a low payout ratio of less than 20%. This screen is shown below.

FINVIZ screening tool

Source: FinViz.com

The payout ratio is defined by Investopedia as “the proportion of earnings paid out as dividends to shareholders, typically expressed as a percentage. The payout ratio can also be expressed as dividends paid out as a proportion of cash flow.” It is the dividend per share divided by the earnings per share.

Lower payout ratios are generally considered to be safer. An example can illustrate that point.

If the payout ratio is greater than 100%, that means the company is paying out more in dividends than it is earning. In the long run, that is likely to be unsustainable and would indicate the dividend is not safe.

Four Safe, High income Stocks

The criteria we used left us with just four stocks to consider as buys.

four stocks

Source: FinViz.com

These are simply stocks that passed a quantitative screen. Additional research could be useful.

For example, British American Tobacco p.l.c. (NYSE: BTI) made the list. Its dividend is 7.8%. But, the company was the recent subject of significant news stories.

Earlier this month, the Food and Drug Administration announced plans to ban on the sale of menthol cigarettes. The rules could take up to two years to be finalized but traders reacted quickly to the news by selling BTI.

The company makes and sells Newport, one of the most popular menthol brands in the United States.

Menthol sales account for about one-quarter of BAT’s annual profit, according to analysts at Jefferies. Owen Bennett, an analyst at Jefferies, said, “In terms of how much profit is at risk, though, we think it is way below this.”

“We think many will just switch into a non-menthol variant of their brand versus quitting, or, given the availability of reduced-risk products, will now switch into one of these. The question is then, can the majors take their fair share of those switching?”

The company also has plans to maintain profits after the rule becomes effective. CEO Alison Cooper told investors the company was targeting ambitious growth in “next-generation products”.

But, those products are also in the sights of regulators and there is no guarantee of success. Investors should consider the risks when making investment decisions and add some research even when quant screens are used, especially during a market sell off.

Uncategorized

This Leading indicator Just Screamed a Warning

This Leading indicator Just Screamed a Warning

Analysts tend to divide indicators into various categories. For stock market analysts reviewing economic indicators, categories often include a description of the indicator as either leading, lagging and coincident indicators.

Leading indicators tend to be the most meaningful because they turn ahead of the stock market. The economic data leads the trend in the stock market.

Lagging indicators tend to be useful because they confirm the trend. If leading indicators turn down, for example, and lagging indicators are still moving higher, analysts would expect the worst to be in the future. When leading and lagging indicators are moving together, the trend is well established.

Coincident indicators tend to move with the stock market and they are not usually useful for analysts. This category of indicator tends to be noisy with frequent shifts between up and down trends. In that way, the indicators track the market.

Housing Market Indicators Can Be Important Leading Indicators

The Housing Market Index (HMI) is based on a monthly survey of National Association of Home Builders (NAHB) members designed to take the pulse of the single-family housing market.

The survey asks respondents to rate market conditions for the sale of new homes at the present time and in the next six months as well as the traffic of prospective buyers of new homes. 

In technical terms, the HMI is a weighted average of separate diffusion indices for these three key single-family series. The first two series are rated on a scale of Good, Fair and Poor and the last is rated on a scale of High/Very High, Average, and Low/Very Low.

A diffusion index is calculated for each series by applying the formula “(Good-Poor+100)/2” to the present and future sales series and “(High/Very High – Low/Very Low + 100)/2” to the traffic series. Each resulting index is then seasonally adjusted and weighted to produce the HMI.

Based on this calculation, the HMI can range between 0 and 100. The most recent data indicates a slowdown could be near.

HMI Moves Sharply

As CNBC reported:

“Rising mortgage rates and continued home price growth are hurting affordability and fast becoming a toxic cocktail for the nation’s homebuilders.

Sentiment among homebuilders dropped 8 points in November to 60 in the National Association of Home Builders/Wells Fargo Housing Market Index.

NAHB index

Source: NAHB data

That is the lowest reading since August 2016, but anything above 50 is still considered positive. The index stood at 69 in November of last year and hit a cyclical high of 74 last December.

“Builders report that they continue to see signs of consumer demand for new homes but that customers are taking a pause due to concerns over rising interest rates and home prices,” said NAHB Chairman Randy Noel, a builder from LaPlace, Louisiana.

Of the index’s three components, current sales conditions fell 7 points to 67, sales expectations in the next six months dropped 10 points to 65, and buyer traffic registered an 8-point drop to 45. Buyer traffic had broken out of negative territory earlier this year but now appears to be back in it solidly.

CNBC added, “Some of the nation’s largest publicly traded homebuilders, like Lennar and KB Home, lowered their expectations for sales in 2019 in recent earnings releases. The chart of Lennar is shown below and the stock is in a clear down trend.”

LEN daily chart

There is still a shortage of homes for sale, but newly built homes come at a price premium, and as interest rates rise, new home buyers are consequently hit hardest.

The average rate on the popular 30-year fixed mortgage is now more than a full percentage point higher than it was a year ago. The huge home price gains seen over the last two years are now shrinking, but prices were still up a strong 5.6 percent year over year in September, according to CoreLogic.

“For the past several years, shortages of labor and lots along with rising regulatory costs have led to a slow recovery in single-family construction,” said the NAHB’s chief economist, Robert Dietz.

“While home price growth accommodated increasing construction costs during this period, rising mortgage interest rates in recent months coupled with the cumulative run-up in pricing has caused housing demand to stall.”

Looking at the three-month moving averages for regional builder sentiment, the Northeast rose 2 points to 58. The Midwest fell 1 point to 57, the South declined 2 points to 68 and the West dropped 3 points to 71.

The turn was rather sudden and year over year changes in the data are now deep into negative territory. The next chart shows the year over year percentage change in the data and confirms the shift in sentiment has been rather sudden.

change in sentiment

Source: NAHB data

Bearish Implications for the Stock Market

The shift in sentiment indicates builders expect less activity in the coming months. This would mean potentially lower earnings for companies in the sector, as noted above, and it also indicates lower potential earnings for companies in related sectors.

It’s important to remember a home purchase affects a number of other industries. Financial services companies, including banks, mortgage services and title insurers, are involved in sales. Real estate agents depend on sales to fund their office operations.

Homeowners also often purchase new furniture, appliances, lawn equipment, landscape supplies and other goods when they move. This activity all has a significant impact on the economy. A slow down in new homes sales has a bearish implication for the economy.

Slower sales could affect employment in the construction industry and in industries that are involved in the sales of homes. It also affects suppliers of those industries such as appliance makers and furniture manufacturers.

Many of these industries support good paying jobs and any slowdown in the industries could lead to weaker economic data in other economic indicators. Of course, the weakness extends beyond the data and reflects slower economic growth.

Weaker sentiment among home builders may seem like a single story but it is actually warning of potential economic weakness and a potential bear market. Now is a time for investors to pay close attention to other economic data to confirm the potential slowdown, and possibly avoid large losses in stocks.


Uncategorized

The Truth About Pensions

pensions

Millennials, and in fact almost everyone, seems to long for the good old days. Those were the days when employers offered pensions and retirements were secure. The data certainly shows that’s not how it is for employees right now.

The chart below shows the average tenure, or time on a job, for various age groups. The trend looks like one would expect it to with tenure increasing by age group.

job tenure by age

Source: FiveThirtyEight.com

But, the number of years on a job even for the average employee nearing retirement, those over 55, seems low. In fact, it could be too low to qualify for a pension. Many defined benefit pensions require employees to be on the job for 20 years, or even 30 years, or more to earn a pension.

Some analysts look at the data in the chart above and conclude that the problem is at least in part to do the recent economic stagnation. Many employees lost jobs in the Great Recession which pushed employment to 10% in 2008 and 2009. That reset the clock for many employees who were near retirement.

This creates the longing for the good old days, the times when pensions seemed to be a standard component of a retirement plan.

But the current data is not all that different from what it was a few decades ago.

Average Job Tenure Hasn’t Changed Much

The Bureau of Labor Statistics looked at this problem in 1997, another period of time when employees often longed for the good old days of job security and pensions. Their report, entitled, Employee Tenure in the Mid-1990s, found:

“Among men, median tenure with their current employer fell between 1983 and 1996 in nearly every age group.  The overall median for men remained flat at 4.0 years, however, as the age distribution of employed men shifted to older age groups, where workers have longer tenure. 

Median tenure for women had changed little from 1983 to 1991, but was up slightly in 1996 to 3.5 years, according to data released today by the Bureau of Labor Statistics of the U.S. Department of Labor.”

Data by age group was also provided and the shape of the data distribution will look familiar to the first chart shown above.

median years of tenure

Source: Bureau of Labor Statistics

For those at or near retirement age, from the data points available for 1983 through 1996, the average time on a job was still not enough to generally qualify for a pension based on longevity.

Pensions Were Always Something to Worry About

Barron’s recently noted the generous pensions some large companies offered were only possible, in part, because so few employees qualified for the pensions.

“The reality is that very few people worked at one company long enough to get a pension that could support them in retirement. That’s true even at blue-chip companies like AT&T and IBM, which offered the kind of pensions on which legends are built.

In fact, policy expert Dallas Salisbury, former head of retirement think tank Employee Benefits Research Institute, said he invited a pension actuary who had worked at AT&T to talk to EBRI about how exactly AT&T could afford such rich benefits.

His answer: Only about 10% of employees worked there long enough to get a pension, and just a fraction of them got the full benefits.”

Based on BLS data from the 1970s and 1980s, professionals needed a 30-year tenure before they were eligible for a pension that amounted to 30% of their last year’s income.

Despite the lore of the “company man,” the median tenure for all wage and salaried jobs in 1983 was five years, about where it was in 2016, based on the latest EBRI data.

“This myth that since ‘I worked for a company with a pension, I’d get a good pension’ was the common belief, so people didn’t worry when they should have, and didn’t save,” says Salisbury.

“There isn’t a more acute crisis now. Far more Americans are saving for, and thinking about, retirement—and actually have real benefits.”

The next chart again strikes at the argument that the pensions were generous in the good old days. Even an employee working 40 years at the same company received just more than a third of their pay as a pension payment.

pensions

Source: Barron’s

This demonstrates the problem of retirement income has always been significant. The good news is that more tools are available to deal with the problem now.

What This Means Today

Salisbury, the expert cited above, has advice for retirement planning. First is the near standard advice that to delay taking Social Security until 70, which means a bigger benefit. Many will not be able to do that, but if it’s possible that grows retirement income significantly. In fact, income grows each year the initial receipt of Social Security is delayed.

He also says he has always been a “strong believer” in annuitizing income. One option is longevity insurance, which requires a smaller lump sum and doesn’t usually kick in with payments until someone turns 85; that’s why Salisbury says 70 is the “most efficient” time to buy such a policy.

For those trying to come up with the right formula to tap their nest egg, Salisbury says the Internal Revenue Service’s required minimum distribution formula for when people turn 70½ is a good rule of thumb.

“That’s about as fast as you should take it out,” he says, adding that it encourages people to live within their means, even if that means downsizing.

In other words, some things about retirement haven’t changed: People still need to save more and spend less.

“Is it new and unusual for people to hit retirement with limited savings and having spent their money on their kids’ education? It has happened for decades,” Salisbury says. “The only difference now is that there is data on it.”

This really all means the secret to financial security in retirement for most people is the same as it’s always been. Save as much as possible. Delay retirement as long as possible. And, consider financial products that match your needs.

Longevity insurance and annuities are frequently given bad press. But they are available because they are right for some people. They should be researched and considered by almost all retirees with an open mind.


Uncategorized

Big Banks and Big Investors Warn the Bear Market Could Get Worse

Big Banks and Big Investors Warn the Bear Market Could Get Worse

Investing is challenging for a number of reasons. One reason is that it takes unique insights to succeed. Another reason is that it is important to pay attention to the ideas of others so that you can be on the right side of major trends.

This might sound like contradictory positions. But it does line up with the way major price trends unfold. At the very beginning of a trend and at the end of a trend, the majority of investors will be wrong. But, in the middle of the trend they will be right.

It takes the majority of investors to push prices up or down in a strong trend. At the end of a trend, a few large investors are usually acting ahead of the majority of other investors and their actions are large enough to affect the market action.

It’s always been this way. Charles Dow called the early movers the “smart money” and noted they accumulated stocks as prices bottomed and distributed their shares by selling as tops formed. They were ahead of the crowd.

Big Banks Are Now Bearish

The smart money in the modern markets is the large investors which includes major asset management firms. Some of the largest asset managers are now bearish.

According to ZeroHedge, “UBS’ wealth management oversees $2.4 trillion in capital and entrusted by some of the world’s richest, is poised to underweight stocks as real money and systematic investors pare risk amid flagging bull-market momentum.

According to Andreas Koester, head of global asset allocation at UBS Wealth, the quantitative-investing platform is close to trimming its equity holdings to 20% from a neutral 50%, a shift that would lead to an avalanche of selling as hundreds of billions in stocks are forced to find a new home.

The reason why the so-called Systematic Allocation Portfolio is about to move the relative safety of cash and high-quality bonds over growth-sensitive assets, is due to a deteriorating mix of signals from GDP, PMIs, corporate earnings and retail sales.

The bearish signals from the data-crunching robot are similar to growing warnings on Wall Street about the global economic trajectory even as other robots in the form of commodity trading adviser quants are forced to lighten up on U.S. stock allocations as volatility picks up, resulting in even more selling.

Bearish signals from the data-crunching robot echo fresh warnings on Wall Street about the global economic trajectory while quant peers like commodity trading advisers ease up on U.S. stock allocations.

“At the moment, the momentum signal is strongly negative,” Koester told Bloomberg.

“While the economy is doing fine, the market is worried about something else, and you can argue that it might be protectionism, oil prices, fear of a recession in 2020.”

Yet despite robust global data, equities slumped to their worst month in seven years in October battered by trade wars, valuation fears and rising rates. This has led traditionally cheerful investment banks like Goldman Sachs to call for “a sustained period of low returns” across equities and credit, and warning that “stocks may be about to enter a sustained bear market.”

The firm’s market model is shown below.

bear market bounce profile

Source: ZeroHedge

Bank of America agrees that the decline could continue.

MarketWatch reported, “Michael Hartnett, chief investment strategist at Bank of America Merrill Lynch, who advises a cautious approach because he doesn’t think stocks have touched bottom.

“We remain bearish, as investor positioning does not yet signal ‘The Big Low’ in asset markets,” says Hartnett, in the bank’s closely watched November fund manager survey.

For one, the bank’s Bull & Bear indicator, which tracks investor sentiment is hanging around 3.1, meaning no “contrarian buy signal” is being flagged, he says. The gauge runs from 0 to 10, with the high end representing extreme bullishness and the low end extreme bearishness.

Managers surveyed believe the peak of this bull run is not here yet, with 12% upside seen from current levels, taking the S&P 500 to 3,056 (weighed average). That said, one of three respondents said they think the market has already peaked.”

Where will the S&P 500 peak in the bull run

Source: MarketWatch

The survey also showed that U.S. markets were once again the most favored equity region, with allocation climbing 14 percentage points to a net overweight of 14%.

Cash levels also dropped in November to 4.7% from 5.1%, meaning investors bought into that October correction, upping exposure to U.S. and emerging-markets stocks, REITs and health care, which is now the No. 1 overweight, in the survey.

month-on-month changes

Source: MarketWatch

And in a surprise to few, allocation to global techs fell out of bed, with just a net 18% of managers saying they’re overweight the sector.

most crowded trade

Source: MarketWatch

Big Investors Agree

CNBC’s Jim Cramer noted that a significant “slump in shares of so-called FANG names — the highflying quartet of Facebook Inc, Amazon.com Inc., Netflix Inc. and Google parent Alphabet Inc., that are among the most influential on Wall Street due to their massive market values and the degree by which investors have piled into those investments for hope of consistent growth.”

All of those companies are in a corrective phase, defined as a drop of at least 10% from a recent peak, and Netflix and Facebook shares have shed around a third of their values since hitting 52-week peaks.

Cramer said that the economy is solid and has championed the idea of the Federal Reserve’s pausing, or at least slowing down, its interest-rate-raising initiative to assess current market conditions, aligning himself with President Donald Trump, who has lobbed a number of criticisms at Fed boss Jerome Powell’s plan to normalize interest-rate policy from crisis-era lows.

Steve Cohen, the billionaire hedge-fund investor, is the latest high-profile Wall Street player to remind us the boom times have a shelf life according to MarketWatch.

“I don’t think returns over the next two years are going to be very good. If the market hangs in there, there’s just going to be marginal returns.”

Cohen spoke recently at a fundraiser according to the Financial Times.

“We’re definitely late cycle,” explained Cohen, who rarely comments publicly about the stock market. “So at some point we’re going to enter a bear market, and it’s going to happen in the next year and a half, maybe two.”

Cohen is controversial. His SAC Capital Advisors firm pleaded guilty to securities fraud in 2013 and recently raised $5 billion for his new fund.

As a funny aside to the conversation, Glenn Fuhrman, the co-founder of MSD Capital who was conducting the interview, joked that Cohen is no Warren Buffett of Berkshire Hathaway. Cohen’s response: “And Warren Buffett’s not me.”

That’s a reminder to all of us that it could be best to ignore the fact that Buffett is buying and bullish. Dangers are high and hedgies like Cohen could be best prepared for upcoming market conditions.