Uncategorized

This Hedge Fund Legend Says Expect a Big Decline. Should You Listen?

High profile investors often make market forecasts in the age of CNBC. To some degree, CNBC creates this environment. The business channel needs to fill the trading day with programming. Producers and booking agents spend hours on the phone hoping to score a big name.

When they do obtain an interview with a legendary investor, the network promotes the interview and the financial media picks up on the story. Investors may be left to wonder whether or not they should care about the interview.

The answer is the same answer that addresses many financial questions. It depends.

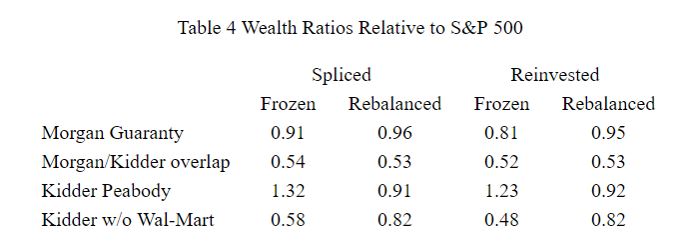
Paul Tudor Jones Says a Decline Is Coming

Jones is a well respected hedge fund manager. In 1980, he founded his hedge fund, Tudor Investment Corporation. Soon after, he created the Tudor Group, a hedge fund holding company that specializes in fixed income, currencies, equities, and commodities.
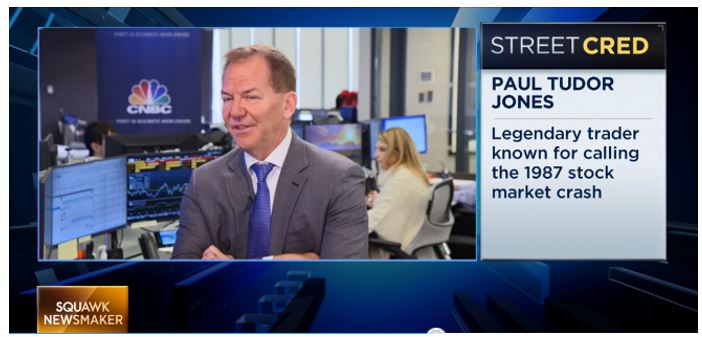
Paul Tudor Jones

Source: CNBC.com

Forbes Magazine estimated his net worth at $4.7 billion, making him the 120th richest person on the Forbes 400 and the 22nd highest earning hedge fund manager. He is known for his large-scale philanthropy and, eight years after founding his hedge fund, he founded the Robin Hood Foundation, which focuses on poverty reduction.

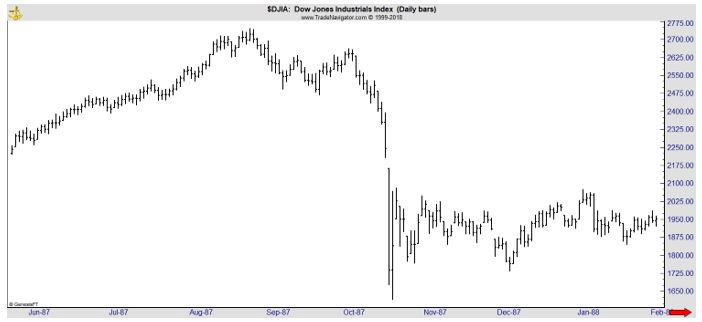
Among traders, Jones is well known for making a fortune in the October 1987 stock market crash.

Dow Jones daily chart

Although Jones trades futures, his technique and philosophy could be useful for individuals to consider:

  • Contrarian attempt to buy and sell turning points. Keeps trying the single trade idea until he changes his mind, fundamentally. Otherwise, he keeps cutting his position size down. Then he trades the smallest amount when his trading is at its worst.
  • Considers himself as a premier market opportunist. When he develops an idea, he pursues it from a very-low-risk standpoint until he has been proven wrong repeatedly, or until he changes his viewpoint.
  • Swing trader, the best money is made at the market turns. Has missed a lot of meat in the middle but catches a lot of tops and bottoms.
  • Spends his day making himself happy and relaxed. Gets out of a losing position that is making him uncomfortable. Nothing’s better than a fresh start. Key is to play great defense, not great offense.
  • Never average losers. Decreases his trading size when he is doing poorly, increase when he is trading well.
  • He has mental stops. If it hits that number, he is out no matter what. He uses not only price stops, but time stops.
  • Monitors the whole portfolio equity (risk) in real time.
  • He believes prices move first and fundamentals come second.
  • He doesn’t care about mistakes made three seconds ago, but what he is going to do from the next moment on.
  • Don’t be a hero. Don’t have an ego. Always question yourself and your ability. Don’t ever feel that you are very good. The second you do, you are dead.

His Latest Views

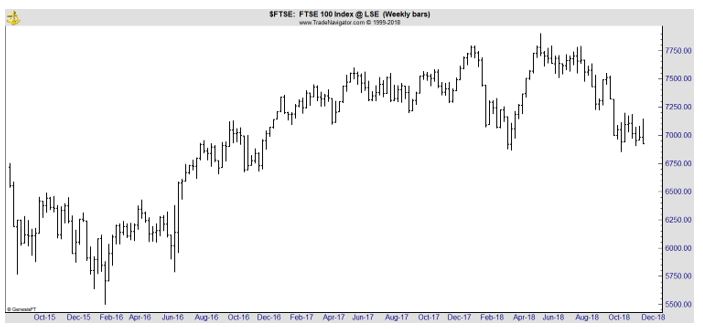
In a recent interview, Jones told CNBC viewers that he expects “the stock market’s wild ride will continue in 2019.”

“I think we’re going to see a lot more of what we just saw, which is a lot more volatility,” Jones told CNBC’s Andrew Ross Sorkin in a “Squawk Box” interview. “It’s really easy to say ‘I’m really bullish’ or ‘I’m really bearish.’ I kind of see a two-sided market.”

“I think in the next year it will be, from where we are today, … at least 10 percent down and 10 percent up; maybe 15 percent either way from where we are right now,” Jones said.

Stocks could fall between 10 and 15 percent next year from current levels, driven by increasing global credit and falling commodity prices, according to Jones.

“We are probably sitting on a big global credit bubble,” he said. “I hope I’m not underestimating the impact the potential negative impact that popping that bubble” will have.

However, this potential decline could lead the Federal Reserve to hold off on raising interest rates in 2019, which could boost equity prices along with continuing corporate buyback programs, Jones adds.

The Fed is expected to hike rates at a meeting next week. “The one thing I would say is there’s a high probability that this hike, assuming they hike, will be the last one for a long time,” said Jones.

But Jones is not always right.

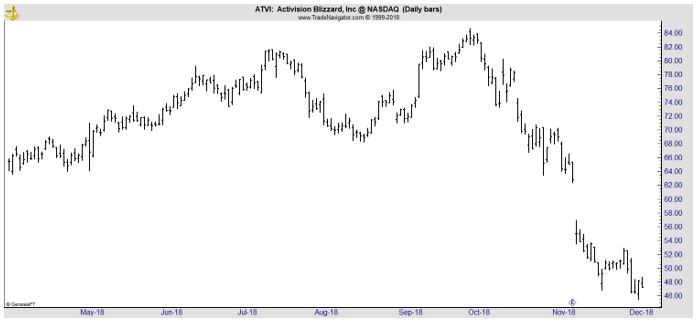
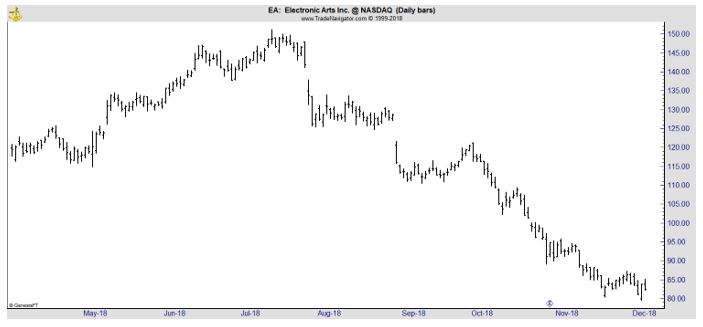
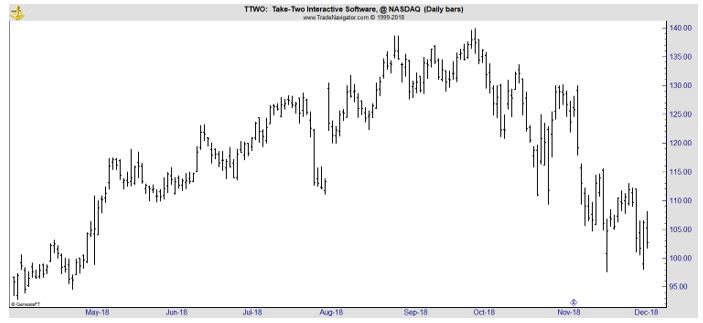
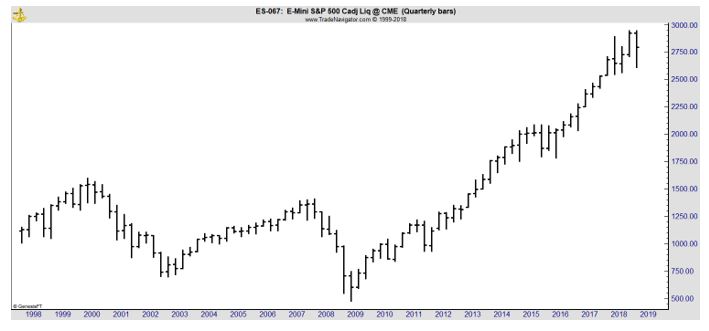
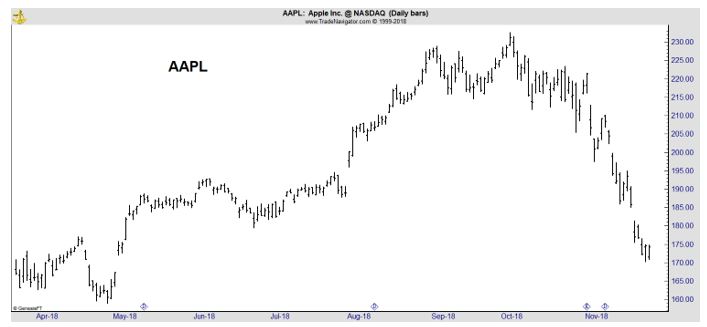
However, he told CNBC on July 12 that stocks could go “crazy” to the upside to end 2018. The S&P 500 is down more than 1 percent for the year and has plummeted more than 10 percent since hitting an all-time high on Sept. 21.

How To Use This Forecast

When watching interviews like this, it could be important to remember that investors like Jones will not necessarily call CNBC and ask for air time when their opinion changes. And this means viewers should not take significant action based on these interviews.

This is especially true when the personality being interviewed is a trader like Jones. This is, of course, Jones’ current opinion. But something could change the analysis at any moment. When the facts change, successful traders like Jones will usually change their opinion.

They may even note that they trade the markets, not their opinions. Their opinions can and do change but their objective which is to make money will remain consistent.

This all indicates that investors should probably watch CNBC for the news and for the entertainment. They could consider the information the experts present as a starting point for research but they should not consider the comments in a short interview to be investment advice.

That may sound familiar. After all, that disclaimer is commonly seen on the network, on other business news channels and in many financial articles in other media besides television.

But it is difficult for some to do. They know that Jones made a fortune trading and may overweight his opinion, forgetting that Jones isn’t locked into that opinion. He will adapt to the market action and all investors, no matter how large or small their account, should be prepared to adapt as the market action dictates.

Uncategorized

This Could Be the Season for Video Games

While they were once popular just among teens, video games are increasingly popular among all age groups and demographics. It may be surprising, but games can even benefit senior citizens.

According to APlaceForMom.com:

“Researchers at North Carolina University discovered the benefits of video games for seniors, after some seniors improved their cognitive focus while playing the video game World of Warcraft or WoW for two hours a day, over a two week period.”

WoW is one of the games developed by Activision Blizzard, Inc. (Naadaq: ATVI). The company’s games include the following list:

Source: ActivisionBlizzard.com

According to the study cited by APlaceForMom.com:

“WoW was proven to be good for seniors and is currently ranked as the world’s most popular multiplayer role playing game with more than 15 million subscribers, according to stats from Guinness World Records.

The benefits of the video game were assessed by Anne McLaughlin and Jason Allaire, psychology professors at North Carolina State University who run a “Gains Through Gaming Lab” to determine whether the game could make peoples’ “brains work better who were at a relatively advanced age.”

The Findings? Intriguing, To Say The Least…

The gaming study involved over 30 older adults, aged 60-77, to play the video game WoW for roughly two hours a day over a two-week period. There were two groups involved in the study:

  • Test Group — A group given a cognitive exam both before the test period began and after the experiment ended.
  • Control Group — A group given the same cognitive exams, that didn’t play the game.

At the end of the two weeks, the people who had scored well on the baseline test had little change to their scores. But the people who had initially scored low showed significant improvement in both spatial ability and cognitive focus, after their exposure to the video game.

“The people who needed it most — those who performed the worst on the initial testing — saw the most improvement,” Allaire said.

Results of the study were published in the peer reviewed journal, “Computers in Human Behavior.”

The researchers even complied a list of the best games for seniors, noting, “We all know that exercising the mind is important. The brain is a muscle and needs stimulation, after all. WoW, in particular, is a very engaging game.

In fact, Allaire and McLaughlin were selective when choosing the appropriate video game for their study.

“It [WoW] met the criteria we had,” Allaire said. “Primarily that it is really engaging and cognitively complex, so we chose a game that we thought would have the best chance of exercising older adults’ cognitive abilities and thereby improving them.”

WoW’s scaffolding (or tutorials that help someone who is not familiar with video games figure out how to make their way around the game) and customizable interface (allowing for larger text for game readability) also came in handy when choosing an appropriate game.

Many of the seniors who participated in the study really enjoyed the game and have become fans. Even though the study is complete, they continue to play the engaging game — a hobby that is now known to be healthy for both their IQ and mental capacities.

They also found NeuroRacer and War Thunder could benefit seniors.

The Investment Potential

The stock of ATVI has recently been in a sharp downtrend and fallen more than 40%.

ATVI daily chart

According to Barron’s, JP Morgan analyst Alexia Quadrani is bullish on the stock at this level. “Investors are so focused on near-term execution, they’ve forgotten what got the stock to those highs in the first place,” Quadrani wrote in a recent research note.

Quadrani said there is “an attractive entry point for what remains a compelling long-term story driven by a secular shift to digital, extension of core intellectual property to mobile, an expanding console and player base and continued innovation in live services.”

The analyst recently upgraded Activision shares to Overweight from Neutral, though she also lowered her price target on the stock to $66 from $72, below Factset’s average near $73. (Earlier this week, we covered some other analysts’ optimism about the stock.) 

“The current valuation gives Activision little credit for options such as King advertising, Esports expansion and revenue growth, or new mobile titles,” Quadrani wrote.

The Other Side of the Story

Analysts at Bernstein also recently issued a research note on the game makers. The analysts noted “a painful price rediscovery exercise on the videogame publisher stocks. Investors are questioning everything: what is the right baseline earnings, what is the right growth rate, what is the right multiple.”

Top stocks in the sector, analyst Todd Juenger wrote, are down about 40% on average from highs, a much steeper pullback than has been projected in earnings forecasts—despite general optimism about the industry’s growth opportunity.

“Six months ago the market thought of Electronic Arts (Nasdaq: EA) as a company with $6 earnings per share power, trading at 25 times earnings, [which] makes it a $150 stock,” Juenger notes. “Now the market is thinking more like $5 EPS power, trading at 17 times, for an $85 stock.”

EA daily chart

Bernstein lowered its price targets on Activision, EA and Take-Two Interactive (Nasdaq: TTWO), setting $50, $108, and $160 targets on them, respectively. The first two are below Factset’s average targets, though Take-Two’s is 11% higher.

TTWO daily chart

The concern, according to Juenger, is competition, best represented by the hot independent battle-royale game Fortnite. The videogaming phenomenon continues to gain players, but also shows that established players are more vulnerable to disruption than investors may have realized.

“Apparently, the barriers to entry aren’t as high as we thought,” Juenger wrote. “We thought they were even getting higher (bigger, more expensive games; the network effect of multi-player). Instead, Fortnite has proven it is possible for an independent studio to break through with a free-to-play game that takes significant share.”

“What matters most to the sustainability of growth over time is the competitive barriers for different game franchises,” he wrote, suggesting that Activision’s mix of games may leave it more vulnerable than its counterparts for now.

This means there is no clear answer on the sector. In the long run, ATVI could be a bargain. EA could also be attractive. Investors may want to put those stocks on their watch lists or use options strategies to limit risk of trading the stocks now.

Uncategorized

Here’s Why Analysts Are Watching for the Next Sears

The story of Sears is one of change. At first, Sears led the change. But, in the end Sears was unable to meet the demands of the changing retail environment. When thinking of Sears right now, the stock’s chart might summarize the image for many consumers and investors.

Sears chart

Source: Standard & Poor’s


The company is in bankruptcy and the stock is down from price levels near $125 a share to levels near $0.25 a share. But it wasn’t always obvious Sears would end up in bankruptcy.

A History of Innovation

Sears had adapted and led the retail environment for many years after it was founded in 1886 by Richard W. Sears as the R.W. Sears Watch Company. Encyclopedia Britannica explains the company was founded:

“to sell watches by mail order. He relocated his business to Chicago in 1887, hired Alvah C. Roebuck to repair watches, and established a mail-order business for watches and jewelry. The company’s first catalog was offered the same year.

The company grew phenomenally by selling a range of merchandise at low prices to farms and villages that had no other convenient access to retail outlets.

The initiation of rural free delivery (1896) and of parcel post (1913) by the U.S. Postal Service enabled Sears to send its merchandise to even the most isolated customers. Rosenwald succeeded Sears as president of the company in 1909.

Between 1920 and 1943 Sears owned Encyclopedia Britannica, which it sold through the catalog. In 1924 General Robert E. Wood joined the company and became its guiding genius for the next 30 years.

Wood noted that the automobile was making retail outlets in urban centers more accessible to consumers in outlying suburbs and rural areas. To exploit this opportunity, he opened the first Sears retail store (in Chicago) in 1925, and the number of stores increased so rapidly that by 1931 retail sales had topped mail-order sales.

The company flourished in the economic boom after World War II and was not seriously challenged as America’s largest retailer until the 1980s, when the Kmart Corporation surpassed it in total sales. Wal-Mart eventually surpassed both and became, before the end of the 20th century, the largest retailer in the world.”

Sears’ innovations can be seen in the ad below which noted the ability to buy now and pay later in addition to obtaining service on a range of products.

opening of Sears store

Source: Smithsonian.com

The company also owned the Allstate Corporation, an insurance company founded by Sears in 1931; Dean Witter, a financial services firm; Coldwell Banker real estate; and the Discover credit card which it introduced in 1985.

Sears also saw the importance of the internet and started Prodigy as a joint venture with IBM in 1984.  Prodigy was an online service that offered its subscribers access to a broad range of networked services, including news, weather, shopping, bulletin boards, games, polls, banking, stocks, travel, and a variety of other features.

Initially, subscribers using personal computers accessed the service by means of copper wire telephone service and modems.

For its initial roll-out, Prodigy supported 1,200 bit/s modems. To provide faster service and to stabilize the diverse modem market, Prodigy offered low-cost 2,400 bit/s internal modems to subscribers at a discount. These were fast for the time.

The company claimed it was the first consumer online service, citing its graphical user interface and basic architecture as differentiation from CompuServe, which started in 1979 and used a command-line interface. By 1990 it was the second-largest online service provider, with 465,000 subscribers trailing only CompuServe’s 600,000.

But Sears Floundered

Eventually Sears stores suffered. It wasn’t because the company ignored the internet. In fact its online sales were at one point significant. And, as late as 2007, Sears was larger than Amazon when measured by market cap as the chart below shows.

Sears vs. Amazon

Source: Standard & Poor’s

Amazon has destroyed a number of competitors as it rose to prominence. Now, analysts are looking for the next Sears and one analyst recently noted that Kroger (NYSE: KR) could be the next Sears, according to MarketWatch:

“A comment from Kroger Co. Chief Executive Rodney McMullen has given GlobalData Retail’s Managing Director Neil Saunders a sinking sense of déjà vu, going back to Eddie Lampert and Sears Holding Corp.

On the earnings call, McMullen talked up Kroger’s digital advancements. The grocer reported third-quarter digital sales growth of more than 60%.

“We’re moving from a traditional grocer to a growth company with both a strong customer ecosystem that offers anything, anytime, anywhere, and asset-light, high-margin alternative partnerships and services,” he said, according to a FactSet transcript.

Saunders worries that Kroger will focus too much on digital at the expense of stores, many of which he says “feel run down and dispiriting” and don’t highlight what Kroger has to offer.

“This mantra was also one peddled by Eddie Lampert, who used it to justify the deterioration in stores,” Saunders wrote. “This did not work well for Sears and ultimately, we do not believe it will work out well for Kroger unless the company comes up with a more balanced growth strategy.”

To be sure, Saunders isn’t against Kroger’s tech investments; he calls the Ocado partnership “appropriate and necessary.” But online grocery has yet to take off.

Of course, Kroger could fare better than Sears. The long term stock chart of KR shows room for optimism.

KR monthly chart

The stock has pulled back significantly from its 2015 highs as investors, and the company’s management, noticed the changes in the retail environment. Online shopping for grocers, as analysts note, hasn’t really taken off yet.

That means traditional retailers like KR still have ample opportunities in their core businesses as they attempt to grow the new markets. KR is innovating, offering curbside deliver, home delivery and other conveniences.

Analysts expect slow growth in the company with earnings per share growth averaging about 5% a year. With a price to earnings (P/E) ratio in the single digits, it could be possible that slow earnings growth is priced into the stock. Now could be a time for value investors to consider KR, despite the worried headlines about how the company could be the next Sears.


Uncategorized

An Often Overlooked Problem With Buy and Hold

Buy and hold is a popular investment strategy. While that term, buy and hold, is widely used, it might mean different things to different investors. Buy and hold is formally defined by Investopedia as:

“a passive investment strategy for which an investor buys stocks and holds them for a long period regardless of fluctuations in the market. An investor who uses a buy-and-hold strategy actively selects stocks but has no concern for short-term price movements and technical indicators.

Conventional investing wisdom shows that with a long time horizon, equities render a higher return than other asset classes such as bonds.

Recognizing that change takes time, committed shareholders adopt buy and hold strategies. Rather than treating ownership as a short-term vehicle for profit in the mode of a day trader, buy-and-hold investors keep shares through bull and bear markets.

Therefore, equity owners bear the ultimate risk of failure or the supreme reward of substantial appreciation.”

The risk of failure may be higher than some investors realize but may be more likely than the possible realization of substantial appreciation.

Examples of Buy and Hold Strategies

One reason for the popularity of buy and hold investing lies in the fact that investors are subject to biases. One of those biases is that investors sometimes see what they want to see. More formally, that is the confirmation bias, also called confirmatory bias or myside bias.

Confirmation bias is the tendency to search for, interpret, favor, and recall information in a way that confirms one’s preexisting beliefs or hypotheses. It is a type of cognitive bias and a systematic error of inductive reasoning.

People display this bias when they gather or remember information selectively, or when they interpret it in a biased way. The effect is stronger for emotionally charged issues and for deeply entrenched beliefs. Confirmation bias is a variation of the more general tendency of apophenia.

A series of psychological experiments in the 1960s suggested that people are biased toward confirming their existing beliefs. Later work re-interpreted these results as a tendency to test ideas in a one-sided way, focusing on one possibility and ignoring alternatives.

In certain situations, this tendency can bias people’s conclusions. Explanations for the observed biases include wishful thinking and the limited human capacity to process information. Another explanation is that people show confirmation bias because they are weighing up the costs of being wrong, rather than investigating in a neutral, scientific way. However, even scientists can be prone to confirmation bias.

Confirmation biases contribute to overconfidence in personal beliefs and can maintain or strengthen beliefs in the face of contrary evidence. Poor decisions due to these biases have been found in political and organizational contexts.

The chart below shows why some investors believe buy and hold investing works.

AAPL quarterly chart

This is a chart of Apple (Nasdaq: AAPL) that shows a gain of nearly 50,000% since the stock began trading in 1980.

The next chart is an example of the data buy and hold investors ignore.

Nikkei Quarterly chart

It’s the Nikkei stock index, the benchmark for Japanese stocks, that shows a 40% decline over the past 29 years.

There are a number of individual stocks in the United States that delivered losses for more than 20 year period. One example is Ford (NYSE: F).

F quarterly chart

There are even more examples of stocks that underperform the broad stock market for extended periods of time. In these cases, an investor’s opportunity cost is high.

Opportunity costs represent the benefits an individual, investor or business misses out on when choosing one alternative over another. While financial reports do not show opportunity cost, business owners can use it to make educated decisions when they have multiple options before them.

Because they are unseen by definition, opportunity costs can be overlooked if one is not careful. By understanding the potential missed opportunities one forgoes by choosing one investment over another, better decisions can be made.

In other words, while owning Ford, an investor missed the opportunity for market beating gains.

Another Problem for Buy and Hold Investors

Without realizing it, some investors ignore what may be the greatest risk that faces a buy and hold investor. The company could simply cease to exist.

One study found that the average life expectancy of a company on the S&P 500 used to be 75 years.  Today that number is just barely 15 years.  Research shows that by the year 2027, 75% of the companies on the S&P 500 will be replaced. 

average company lifespan on S&P 500 index

Source: Innosight

The researchers noted, “There are a variety of reasons why companies drop off the list. They can be overtaken by a faster growing company and fall below the market cap size threshold (currently that cutoff is about $6 billion).

Or they can enter into a merger, acquisition or buyout deal. At the current and forecasted turnover rate, the Innosight study shows that nearly 50% of the current S&P 500 will be replaced over the next ten years.

This projection is consistent with our previous analysis from 2012 and 2016, which Innosight originally conducted with Creative Destruction author Richard Foster.”

Mergers often destroy value and could be a signal to sell long term holding for some investors. Others will hold on believing the management team of the acquired company acted in the best interests of long term investors when selling.

This presents the investor with the agency problem.

The agency problem is a conflict of interest inherent in any relationship where one party is expected to act in another’s best interests. In corporate finance, the agency problem usually refers to a conflict of interest between a company’s management and the company’s stockholders.

The manager, acting as the agent for the shareholders, or principals, is supposed to make decisions that will maximize shareholder wealth even though it is in the manager’s best interest to maximize his own wealth.

The agency problem arises due to an issue with incentives and the presence of discretion in task completion. An agent may be motivated to act in a manner that is not favorable for the principal if the agent is presented with an incentive to act in this way.

The best way to avoid this problem could be to buy and watch the stocks you own. Sell when performance lags or when the initial purchase thesis changes.

Buy and hold does work sometimes. But it may fail more often than understood and presents risks that should be understood by successful investors.


Uncategorized

These Crises Could Drive a Deep Bear Market

Investors are wondering whether or not stocks will continue moving lower. Many are seriously considering the possibility. But others are highlighting that the stock market has frequently pulled back and this could be just another buying opportunity in a bull market.

That argument ignores several important developments. The bull market began in March 2009 and is now almost ten years old. It can’t continue forever, if history is a guide, and the news from around the world is increasingly bearish.

Europe Could Be a Problem

The bull market has been driven in part by easy monetary policy of central banks around the world.

An easy money policy is defined as a monetary policy that increases the money supply usually by lowering interest rates.

It occurs when a country’s central bank decides to allow new cash flows into the banking system. Since interest rates are lower, it is easier for banks and lenders to loan money, thus leading to increased economic growth.

The most immediate effect of easy money, if implemented when the economy is below capacity, may be increased economic growth. In addition, the value of securities rises in the short term.

If prolonged, the policy affects the business sentiment of firms and can reverse course over fears of rampant inflation. This is an effect of forward-looking expectations.

That could all be changing now. Reports indicate the European Central Bank needs to keep its monetary policy easy while tightening slowly as underlying inflation in the euro zone remains weak and global risks such as protectionism loom, ECB policymaker Olli Rehn said recently.

“Core inflation is still rather weak in the euro zone at around 1 percent, as it has been for the last couple of years, so an accommodative monetary policy is still needed in Europe,” Rehn said. This could reverse a long down trend in interest rates.

European Central Bank

Source: TradingEconomcis.com

Higher rates in Europe or an end to quantitative easing could have a bearish impact on stock prices.

Brexit Could Roil Markets

Brexit, according to the BBC, “is used as a shorthand way of saying the UK leaving the EU – merging the words Britain and exit to get Brexit, in the same way as a possible Greek exit from the euro was dubbed Grexit in the past.” 

Britain leaving the European Union after a referendum – a vote in which everyone (or nearly everyone) of voting age can take part – was held in June 2016 to decide whether the UK should leave or remain in the European Union.

Leave won by 51.9% to 48.1%. The referendum turnout was 71.8%, with more than 30 million people voting.

After months of negotiation, the UK and EU have agreed on a deal. It comes in two parts.

There is a 585 page withdrawal agreement. This is a legally-binding text that sets the terms of the UK’s divorce from the EU.

It covers how much money the UK owes the EU – an estimated £39bn – and what happens to UK citizens living elsewhere in the EU and EU citizens living in the UK. It also proposes a method of avoiding the return of a physical Northern Ireland border.

There is also a 26 page statement on future relations. This is not legally-binding and sketches out the kind of long-term relationship the UK and EU want to have in a range of areas, including trade, defense and security.

The UK cabinet agreed the withdrawal agreement text on 14 November, but there were two resignations, including Brexit Secretary Dominic Raab and there was an, as yet unsuccessful, attempt by Brexiteer MPs to force a confidence vote in Theresa May.

The next step is for MPs to vote on the deal, which will take place on 11 December after five days of debate. If they pass it, the European Parliament will get a vote before Brexit day next March.

There are concerns about Brexit and it is affecting stocks in the United Kingdom as the next chart shows.

FTSE weekly chart

After rallying on the referendum and then stalling, prices of the FTSE 100, a benchmark index, are now falling.

France Is Another Concern

Europeans and traders around the world are also watching France where thousands of demonstrators, according to NBC News, known as “Yellow Jackets” due to their fluorescent garb descended into the streets across France over the weekend to protest planned tax hikes on gas.

In Paris, the rallies turned violent recently with blazes set on the world-famous Champs-Élysées avenue while masked protesters waved the French flag. Police responded to skirmishes with water cannons and tear gas. More than 100 people were arrested.

Motorists have blocked highways across the country since Nov. 17, setting up barricades and deploying conveys of slow-moving trucks. Around 280,000 protested in the streets across the country that day, with 106,000 people attending rallies in Paris.

On Jan. 1, the tax on gasoline will go up by around 12 cents per gallon and on diesel by approximately 28 cents per gallon, according to Transport Minister Elisabeth Borne.

Gas taxes will go up by another 5 cents per gallon by 2020, with diesel jumping an additional 2 cents.

On Monday, gasoline cost around $6.26 per gallon in Paris, while diesel was around $6.28 a gallon.

Macron has so far refused to reconsider the hikes, which he says will help reduce France’s dependence on fossil fuels. By raising the cost of diesel, the French government hopes to convince more people to buy less-polluting vehicles.

But he did agree to a six month delay in its implementation.

While the protests were sparked by the looming increase in fuel prices, experts say they have become an outlet for people to express their discontent with the high cost of living in France and with Macron’s presidency more generally.

A poll published on Friday found that only 26 percent of French people have a favorable opinion of Macron.

Joseph Downing, an expert in French politics at the London School of Economics, agreed that the protests were about “much more” than taxes on gas.

“It’s this entire idea of the squeezed middle or the squeezed upper working-class person who feels an entitlement to an ever-increasing standard of living but is something that no politician can deliver,” he said. “This is where we’ve seen disenfranchisement with Sarkozy, with Hollande and now with Macron.”

This is also a potential factor for stocks as the chart of the CAC 40 benchmark index shows.

CAC Index weekly chart

The question is whether these factors can end the long bull market. Investors should consider that possibility and begin preparing defensive strategies.

Uncategorized

Looking Beyond Gold

Gold prices have been rallying. They are now at their highest level since July. And, this could be the beginning of a significant rally in gold prices. That can be seen on the chart of SPDR Gold Trust (NYSE: GLD) shown below.

GLD monthly chart

This ETF makes gold easily accessible to individual investors. Right now, it could be worth considering as a buy.

It’s widely believed that gold prices have historically gone higher in times of crisis. That has often been true. Gold serves as a safe haven investment and could be particularly appealing right now as a number of geopolitical crises threaten, the Federal Reserve could be reversing policy, and the stock market could be declining.

It’s one of those times when it is impossible to completely list all of the global hotspots. Brexit could roil Europe as the European Union struggles with an Italian budget and France faces rioting. All of this is occurring as the European central Bank is expected to reverse its policies early next year.

As it almost always is, the Middle East is a cause for concern. Saudi Arabia, Yemen and Iran are just three countries which could create negative and market moving headlines.

This is often a cause for gold to rally. But, there are other metals that could provide gains to investors.

Palladium Could Be a Buy

According to a recent story in MarketWatch.com:

“In the near-term, palladium’s superior supply-demand backdrop could see it surpass gold,” analysts at precious metals consulting firm Metals Focus wrote in a recent research note.

Palladium is “characterized by the strongest supply-demand backdrop across the major precious metals,” even as mine production stands at historically high levels, leading to an estimated 2018 global supply of 9.7 million ounces—the “second highest total this decade.”

Global automotive demand for palladium, meanwhile, despite weak recent sales of light vehicles in China and the U.S., may “achieve a new record high in 2018 of around 8.5 [million ounces],” the analysts said. The metal is widely used in the pollution-control catalytic converters on gasoline-powered vehicles.

This means the price of palladium is rising and could move above gold. That was how the relationship looks for a time earlier this century.

Gold chart

Source: MarketWatch.com

Platinum Is Also a Potential Buy

The market has also seen a rise in platinum group metals “loadings to meet tighter emissions standards,” Metals Focus analysts said.

Also, “over the past decade palladium automotive demand in Europe has grown noticeably, in part due to substitution gains at the expense of platinum in light duty vehicles, but also as diesel has lost market share to gasoline passenger vehicles.”

Platinum is palladium’s sister metal, is more commonly used in catalytic converters for diesel engines, but in 2015, Volkswagen VOW admitted to manipulating emissions tests on some diesel-power vehicles in the U.S. and elsewhere.

Looking further ahead, however, gold may re-establish its premium over palladium, the Metals Focus analysts said.

“There will be some headwinds” for palladium, “in particular, investors have also been heavy buyers,” and “a sizable overhang has been built up, of around 1.5 [million ounces], which leaves scope for profit-taking,” the analysts said. “In addition, as we move through 2019 and U.S. growth slows, this will weigh on investor risk appetite, which in turn will affect palladium.”

Traders in the futures markets have easy access to these metals.

Individuals could also consider the Aberdeen Standard Phys Palladium Shares ETF (NYSE: PALL), an exchange traded fund with more than $140 million in assets, or Aberdeen Standard Phys Platinum Shares ETF (NYSE: PPLT) which has more than $500 million in assets.

Assets under management is an important consideration for an ETF. That is because smaller funds could be closed because they are not profitable to their sponsors. There is no answer to the question of what the correct minimum amount of assets is. It varies by sponsors and comfort level of individual investors.

Silver Could Also Shine

If gold rallies, it is likely that silver will move higher as well. In this market, the individual investor has a number of investment options.

Given the relatively low price of an ounce of silver, it is possible to simply buy the metal in the form of bullion or coins. This can be expensive and it is important to research dealers to ensure that you are buying from a reputable source.

One advantage of this approach is that silver coins or bullion in the form of bars or ingots is relatively easy to sell. One disadvantage is that spread between the buy and sell prices can be large and it can be expensive to own silver in this way, especially in the short term.

The cheapest way to invest in silver could be with futures contracts but this investment carries significant risks and will not be the right choice for many investors.

There are also silver ETFs including the iShares Silver Trust (NYSE: SLV).

SLV monthly

But you can also invest in silver through mining companies. Shares of miners will generally track the general trend of silver prices, but miners also offer some degree of leverage.

An example might be the best way to explain the leverage miners offer.

Let’s assume it costs a miner about $10 an ounce to produce silver and they mine 1 million ounces a year. If silver is at $11 an ounce, the company should generate a profit of about $1 an ounce or $1 million

This is a simplified example so we will assume the company has no other costs and no additional revenue. The actual model would be much more complex.

If the price of silver increases by 10%, to $11.11 an ounce, assuming the costs of production stayed the same, the miner’s profits would increase to $1.11 an ounce or $1.11 million for the company, an increase of 11%.

The miner is leveraged and benefits immensely from higher silver prices.

Remember, there is no free lunch in the stock market. Leverage can help increase investment returns on the upside but can cause significant losses on the downside. A 10% decline in the price of silver could result in an 11% drop in earnings for this miner.

This leverage makes silver miners an excellent way to invest in silver. The same is true for gold. Buying miners when metal prices are low can lead to large gains when the price of the metal recovers.

Now is an ideal time to consider adding miners to your portfolio.


Uncategorized

Alternative Data: The Next Big Thing

Alternative data has recently become the “next big thing” for investors who are searching for edges and the data is now going mainstream.

Nasdaq (Nasdaq: NDAQ) recently announced today it has acquired Quandl, Inc., a leading provider of alternative and core financial data.

Quandl

Source: Quandl.com

Quandl provides alternative data and core financial data from over 350 sources to more than 30,000 active monthly users.

The company offers a global database of alternative, financial and public data, including information on capital markets, energy, shipping, healthcare, education, demography, economics and society. Examples of alternative data includes data on car sales or movements of corporate airplanes.

Bringing Alternative Data to the Mainstream

Nasdaq plans to combine Quandl with its existing Analytics Hub business within Global Information Services.

Founded in 2012, Quandl is used by eight of the top 10 hedge funds and 14 of the top 15 largest banks. Quandl delivers financial, economic and alternative data to over 400,000 analysts worldwide.

Quandl has also established strategic relationships with many leading data providers to provide institutional and Main Street investors with access to a growing library of data to inform research and trading / investing decisions.

In assessing the overall market opportunity for alternative data across the financial industry, in November 2017, Deloitte estimated that spending on alternative data may exceed $7 billion USD by 2020, with an annual growth rate of 21 percent.

Making Alternative Data More Accessible

Barron’s recently looked at this situation from the perspective of an individual investor.

The sheer volume of data available today, and the price of obtaining it, can be overwhelming for investors unfamiliar with the field. Gaining a quant-like investing edge by examining credit cards or location-tracking apps can mean writing a big check, with no guarantee of success.

Most credit card data starts at $10,000 a year, according to Quandl, a marketplace for alternative data.

Ashby Monk, a Stanford University academic who has studied how funds use data, says that the best way for most investors to use alternative data is as a risk-management tool rather than as an idea generator.

“It’s a smart way to begin to dip your toe in the world of alternative data and not get caught up in the arms race,” Monk says. “Think of this as a risk tool to help you better understand your portfolio and the assets you’re investing in, rather than trying to spot some trade that you want to make.”

Michael Recce, chief data scientist at Neuberger Berman, uses only about five major sets of data and buys them on a delayed basis, a tactic that allows him to pay as much as 90% less for the information.

He’s willing to have “old” data because it’s meant to complement, not replace, the fundamental-investment process. “If you care about long-term capital gains, you don’t care if it’s one month old,” he says. Recce uses job-posting, online-shopping, and credit-card data.

For do-it-yourself investors, e-brokers have begun expanding their alternative data offerings, too. TD Ameritrade allows people to access the social-sentiment app LikeFolio in their trading accounts.

Sentieo, another start-up data provider, offers tools that combine alternative and traditional data on its platform, which costs $500 to $1,000 a month.

Brokers See An Opportunity

Sell-side firms—bankers, brokers, and research shops that analyze and market investments—are also stepping in to guide investors through the minefield.

The buy side—asset managers—tends to be “massively ahead” when it comes to new investment trends, but this time “we’re starting from a similar point as our buy-side partners,” says Dan Furstenberg, global head of equity hedge fund distribution and head of data strategy at Jefferies.

For fund managers worried that they have already missed the data boat, he says their concern is misplaced.

Only about a quarter of managers Jefferies surveyed last year were high-volume users who look at more than 50 data sets. “For traditional portfolio managers, it’s incredibly early,” he says. “We’re in the first inning.”

Veteran asset managers may not be keen on using the data, but it’s likely to become a must-have for the next generation. “It’s really hard to transform the very discretionary process of a 50-year-old portfolio manager,” says Leigh Drogen, the CEO of Estimize.

estimize

Source: Estimize.com

“They know that they just have to hang around another 10 years and collect money. They don’t want to go learn [programming language] Python. The 30-year-old at that fund knows they’re not going to have a job in 10 years if they don’t learn it.”

Recce thinks fund managers—even the well-seasoned ones—can learn to program. He’s planning to teach a class on computer science at Neuberger Berman.

The people most at risk from the shifting trends could be traditional sell-side analysts, argues Daniel Goldberg, the founder of consulting firm Alternative Data Analytics.

“You’re going to get more money going to analytical tools than to sell-side research,” he says. “Data will be the new consensus estimate. Instead of the sell-side providing estimates, the data will do that every day.”

As a starting point, individual investors could turn to Estimize or considering searching through the Federal Reserve data base for free. Fred Economic Data is available here. For example, here investors can find data on Italy’s unemployment rate.

unemployment rate

Source: Federal Reserve

On Fred, investors will actually find 2,613 data series on Italy. That data can be combined with data from the United States and could include a limited history of stock market data. Using this capability investors could search for data that leads market turns.

Fred data can also be exported to Excel for more detailed analysis. This is a rich source of untapped data in many cases. The site actually contains more than 528,000 data series and new data is being added quite often.

This task won’t be easy, but the use of alternative data has not been easy for large investment managers to master. However, the rise of alternative data demonstrates, and largely confirms what many investors already believe, that the widely available data such as earnings isn’t enough.

Maybe earnings data was never enough to earn big profits but it seems that it is more difficult today. It could pay for individual investors to wade into the study of alternative data with Fred.


Uncategorized

What Individual Investors Can Learn From GE’s Pension Plan

General Electric (NYSE: GE) has been in the news quite a bit recently. Analysts have been cutting price targets, some citing operational concerns while others cite pension obligations and the lack of a clear plan for a turnaround.

The stock has certainly been in an extended down trend.

GE weekly chart

The company’s operational shortcomings are likely to be the subject of business school case studies for several years. They are interesting. But the company’s retirement plan could be among the most important lessons for individual investors.

GE’s Plan Is Underfunded

GE (has about 430,000 retirees and active workers covered by defined benefit pension plans according to a recent report in Barron’s.

It’s important to note that defined benefit plans are increasingly unusual. These type of plans promise retirees fixed payments every month for life. This is different than an individual plan or a company’s more common fixed contribution plan where companies make regular payments to a 401(k).

Despite these differences, the problem GE faces are illustrative of the problems individuals can face in their own plans. This will be true no matter type of plan an individual is funding and relying on for retirement.

According to the Barron’s article:

“In all, GE’s workers have been promised about $100 billion in payments, but the company has only $71 billion in assets set aside to meet those obligations.

There’s no consensus among investors and analysts about the GE pension plan. Some analysts fret about the funding gap. Others argue that pension gaps are only theoretical—because a pension number isn’t like a bond with a face amount and a fixed maturity.

Those who downplay concerns also argue the funding situation is spelled out clearly for anyone willing to read the notes to the financial statements.

So is it, or isn’t it, something to worry about?”

For Your Individual Plan, Underfunding Is Something to Worry About

GE’s plan, as noted covers 430,000 retirees. The law of large numbers indicates that the plan is likely to pay out $100 billion but the amount could be more or less. That’s why some analysts aren’t worried about the plan. If the company ends up owing less, funding the plan now would waste resources.

But it is especially important to note that “pensions don’t usually become an issue for investors until the stock market declines, shrinking the value of the assets set aside to pay workers.”

This is an example of how analysts can, at times, make overly optimistic assumptions. Notice that they usually don’t worry about pensions until the market declines. The chart below shows that markets do decline significantly at times.

quarterly bar chart

This is a chart of the S&P 500. When a plan covers hundreds of thousands of individuals, there is time to recover from losses. That’s simply because some will retire and some will continue to work during the market down turn.

With an individual plan, if the individual intended to retire in 2000 or 2008 as the down turns shown above were beginning, it would have been difficult to retire. The individual could have extended their working career due to a bear market.

One way to address this problem is to overfund the retirement account. But, for an individual that isn’t usually possible. The individual investor has competing claims against their limited resources and must fund current expenses while saving for retirement. That makes adequate funding a challenge and overfunding is unlikely.

Help Could Be On the Way

GE could be bailed out by higher interest rates.

“Higher interest rates also help shrink pension liabilities, reducing the present value of open-ended obligations. Discount rates track bond yields and the 30-year bond yield is up about 0.5 percentage point this year.

GE disclosed in its 2017 annual report that a 0.25 percentage-point increase in rates would shrink the pension obligation by $2.2 billion. That’s just how the math works.”

The math could work the same way for individuals. New investments into fixed income will carry higher yields and generate more income.  This could be especially helpful to a large fund but it is also at least somewhat helpful to an individual investor.

After a decade of below average interest rates, higher rates could have a significant impact on expected retirement income.

The experts noted that GE has several options. “Adding cash to the plan is one option. GE could also move a portion of its pension off the books entirely.

Steve Catone, a senior consulting actuary at Korn Ferry , told Barron’s that, “companies have been immunizing themselves from old pension obligations by purchasing annuities with insurance companies.” He added, “you can retire a pension plan for good for about 15% of the benefit obligation.”

Of course, you have to transfer the pension assets along with the liability. That could get expensive, and GE may want to hang onto its available liquidity.

But the company may be able to leverage higher rates and recent contributions to lower its obligation permanently. With the right mix of choices, GE could take the pension issue off the table for years to come.”

This could describe an approach for an individual to consider. When a company moves the pension obligations off its books entirely, it is generally selling the plan to an annuity provider.

An annuity is a contract between you and an insurance company in which you make a lump sum payment or series of payments and in return obtain regular disbursements beginning either immediately or at some point in the future.

The goal of annuities is to provide a steady stream of income during retirement. That goal is the same for company pension plans or individual retirement accounts. The steady stream of income could be combined with Social Security and other investments to meet the needs of some individuals.

Annuities are not right for everyone and even if they are the right choice for an individual, there are many products on the market that may not be suitable. Some annuities carry high costs, and some have other features that make them undesirable for many investors.

But annuities should be considered by many investors just like they are considered by large companies. Further consideration may lead to rejecting the product, but at least that will be an informed decision.

Uncategorized

Value in a Bear Market

We may very well be in the early days of a bear market. No one knows for sure until the Dow Jones Industrial Average declines at least 20% from its high. That’s the official definition of a bear market.

But by the time the Dow falls that much, a number of individual stocks will have fallen significantly more than that. This means that individual investors could be facing large losses well before the experts on CNBC announce that we are officially in a bear market.

That leads to the question of what can be done about a bear market and the answer from the perspective of an individual investor could sound remarkably similar to what an investor could do about a bull market. They could consider applying a value methodology.

Value Cuts Both Ways

Many individual investors spend a great deal of time looking for value. They buy stocks that are undervalued. That is a strategy that has been proven to work in the long run for many investors. But at any given time there will only be some stocks that are undervalued. The rest will be either fairly valued or overvalued.

It is the overvalued stocks that could be of interest in a bear market. After all, in the long run value works according to a number of studies. Undervalued stocks tend to beat the market, on average, as a group.

Those studies, especially the ones that are published in academic journals, usually include an evaluation of overvalued stocks as well. The studies often show that undervalued stocks underperform the broad stock market, on average, as a group.

For example, the studies may look at a valuation tool like the price to earnings (P/E) ratio. Low P/E ratios indicate a stock is potentially attractive. High P/E ratios highlight, for many individual investors, the stocks that could be avoided.

In the studies, the authors often assume the low P/E stocks are bought and the high P/E stocks are shorted. When an investor buys a stock, they profit when the price of the stock goes up. When they sell a stock short, they profit from a decline in the value of the stock.

We will not go into the mechanics of shorting a stock. It is a high risk strategy that may not be suitable for many individual investors. But investors can also benefit from a price decline with a put option.

A put option gives the buyer the right but not the obligation to sell 100 shares of a stock at a predetermined price for a specified amount of time. The mechanics of owning put options can be confusing but interested investors should consider researching options.

One advantage of a put option compared to selling a stock short is that the risk is limited and well defined when buying a put. An option buyer can never lose more than the purchase price of an option which is often just a few hundred dollars or less, and can even be less than $100.

Finding Value Like a Quant

A quantitative approach to investing relies on computers to identify characteristics of successful stocks. Based on historical performance of that factor, the investor buys all stocks that meet the defined criteria.

Quants often use a computer output to drive all decisions. They may not supplement that output with any other analysis. This has provided success and outsized returns to some investment managers.

But, for many years it required expensive data sets and customized programming skills to find stocks with a quant strategy. Now, those tools are available to individual investors and some tools to implement quant strategies are even available for free.

A Free Quant Screening Tool

One way to find stocks meeting a variety of predefined requirement is with the free stock screening tool available at FinViz.com. At this site, you could screen for a variety of fundamental factors like free cash flow, high levels of institutional ownership and bullish institutional transactions.

There were 7,547 stocks in the database on a recent day. We want to search for just a few that could be good investments. We will focus solely on fundamentals criteria. There is no guarantee these stocks will be safe but we use quant criteria in an attempt to limit risk.

To ensure the stock is tradable at a reasonable cost, even in a market crash, we will limit the search using market cap selecting just the largest stocks which is defined in FinViz as stocks with a market cap of at least $10 billion. All selections are made with pull down menus as shown below.

We will also require the stock to be optionable. Then we will search for potentially overvalued stocks by looking for high income (a dividend yield of at least 5%) and for risk we required a high payout ratio of over 100%. That indicates the dividend might be cut.

This left us with 15 stocks. That could be a wonderful starting point for research for many investors. But we will add one more filter to reduce the number of stocks. The number of stocks to research can be a significant limiting factor for individual investors since research takes time.

We added a requirement for low analyst expectations. In this case, we looked for stocks where analysts expect earnings per share (EPS) growth to be less than 5% a year, on average.

This screen is shown below.

screening tool

Source: FinViz.com

Three Potentially Overvalued Stocks

The criteria we used left us with just three stocks to consider.

Three Potentially Overvalued Stocks

Source: FinViz.com

These are simply stocks that passed a quantitative screen. Additional research could be useful. But these could be stocks that offer potential gains in a bear market because they are overvalued by some measures.

It is possible for value investors to consider flipping their preferred criteria to benefit in a market decline. The same principles that are used to find stocks to buy, in many studies, have been effective at finding stocks that are vulnerable to declines.

This fact could be especially interesting now as the market appears vulnerable to a decline.


Article

This Is Why Smart Investors Study History

After the recent selloff in tech stocks, some investors are wondering if it is time to buy the FAANGs. The FAANG stocks are Facebook, Amazon, Apple, Netflix and Alphabet, parent company of Google. They led the market on the way up and have all delivered sharp declines to share holders.

But declines are often viewed as buying opportunities. That is the basis of the investment strategy known as buying the dips which means to enter a stock after it pulls back from its highs. The FAANGs have certainly dipped with losses of 20% or more. Apple is shown below with its 26% decline.

AAPL stock chart

History Favors the Bears

Traders often quote, or at least paraphrase, the European philosopher George Santayana who said, “those who cannot remember the past are condemned to repeat it.” In the stock market, there is a great deal to be learned from a study of the past.

In fact, the FAANG story could be leaving older investors with the feeling that they have seen this story before. In the late 1960s, instead of the FAANGs, investors talked about the Nifty Fifty.

The term Nifty Fifty was an informal designation for fifty popular large-cap stocks on the New York Stock Exchange in the 1960s and 1970s that were widely regarded as solid buy and hold growth stocks, or “Blue-chip” stocks.

These fifty stocks are credited by historians with propelling the bull market of the early 1970s, while their subsequent crash and underperformance through the early 1980s are an example of what may occur following a period during which many investors, influenced by a positive market sentiment, ignore fundamental stock valuation metrics.

Various sources assign different stocks to the group but many agree on many of the names. Lists were published by leading brokers of the day including Morgan Guaranty and Kidder Peabody. One list of the Nifty Fifty stocks is shown below.

NYSE Nifty Fifty

Source: Wikipedia

These stocks delivered great gains for a time but they fell quickly. In The Nifty-Fifty Re-Revisited, a paper by economists Jeff Fesenmaier and Gary Smith, the depth of the decline is easy to see. The authors noted,

“in the memorable words of a Forbes columnist, the Nifty Fifty were taken out and shot one by one. From their 1972–1973 highs to their 1974 lows, Xerox fell 71%, Avon 86%, and Polaroid 91%.”

As a group, the stocks performed relatively well in the long run. The table below shows the performance of different lists updated through 2001. The ratios show the performance relative to the S&P 500 with values above 1 indicating outperformance and valued below 1 showing underperformance.

wealth ratios

Source: The Nifty-Fifty Re-Revisited

He performance is close, “in comparison to the S&P 500’s 12.01% annualized return over this period, a portfolio of these 50 stocks would have had annualized returns of 11.64% (a frozen portfolio that is initially equally weighted) or 11.85% (rebalanced monthly to be equally weighted).”

But the gains are largely due to the performance of just a few stocks.

Returning to the paper,

“Only ten stocks on the Kidder Peabody list beat the S&P 500, but one did so spectacularly. Wal-Mart’s 26.96% annualized return over this 29-year period was the third highest in the entire CRSP data base.

The only stocks to do better were 28.94% for Southwest Airlines and 29.65% for Boothe Computer, now Robert Half International.

Perhaps, buying a high P/E stock is like buying a lottery ticket: the expected return is not good, but there is a chance of a huge payoff. Here, 80 percent of the Kidder Peabody stocks underperformed the market, but one (yes, one with a P/E above 50) hit the jackpot.”

Looking Ahead

It’s possible the FAANGs will be similar to the Nifty Fifty. That would mean the stocks carry additional down side risks and they should be avoided by bargain hunters. That is the opinion of two analysts recently featured in MarketWatch:

“Canaccord’s Martin Roberge and Guillaume Arseneau noted that [p]ortfolio managers haven’t seen any big hurt when it comes to that group of growthy stocks because year-to-date, some of those tech-focused names are still outperforming the market, they note.

Beaten-down Apple is still up nearly 3% year-to-date, against a 0.3% rise for the S&P.

“We expect the real pain will come when a clear rotation occurs. This rotation should get under way when it becomes clear that earnings growth for FAANGs and other technology names in 2019 do not live up to expectations,” said the Canaccord analysts.

And that second wave of selling should start in January when fourth-quarter results start rolling out, they say.”

The analysts could, of course, be wrong. But it could be best for conservative investors to wait for a few weeks before nibbling on the FAANGs. And then, perhaps Amazon and Netflix should be left for the just the most aggressive investors.

The reason for that is the high P/E ratios of those two stocks. The next table shows the P/E ratios of the FAANG stocks.

FAANG stocks

Source: TheIrrelevantInvestor.com

Although Amazon is growing, it is richly priced. The stock market expert Jeremy Siegel has important thoughts to remember on high P/E ratios. Siegel is a Professor of Finance at the Wharton School of the University of Pennsylvania and has studied market history covering hundreds of years.

Siegel noted of the Nifty Fifty, “It was so easy to forget that probably no sizable company could possibly be worth over 50 times normal earnings.” That would apply to Amazon and Netflix for now.

Apple, it could be argued, is reasonably valued and the same could be true for Facebook which dropped more than 40% from its high. But, remember that in the case of the Nifty Fifty, some of the stocks fell more than 90%. A few did deliver strong returns later but few beat the market.

And, that is important for investors to consider at this point. The FAANGs might have a bubble and delivered great gains for a time. But there will probably be new market leaders in the next bull market and it could be best to focus on finding the next FAANGs.