Uncategorized

Can the Fed Save the Stock Market?

The Federal Reserve, according to many analysts, was responsible for the great bull market in stocks that began in 2009. One explanation for the relationship is shown in the chart below.

all about QE

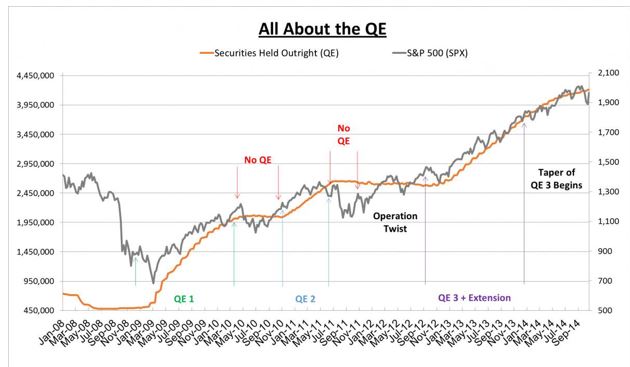
Source: AdvisorPerspectives.com

According to Peter Schiff of Euro Pacific Capital, the above chart tells the story of the Fed:

When the markets crashed in the fall of 2008, the Fed announced Quantitative Easing (QE1), a plan to purchase $600 billion in mortgage-backed securities (MBS) and agency debt, which was later expanded in March 2009 by another $750 billion.

QE1 expanded the Fed’s balance by 247%, to $1.43 trillion. Over that time, the S&P 500 put in a rally of 71%.

But from April to November 2010, with QE on hiatus and the Fed’s balance sheet hardly expanding, stocks declined by about 11%. But when Fed Chairman Ben Bernanke strongly hinted in August 2010 that the Fed was ready to launch another round of QE, the markets rallied 18% in five months.

By the time QE2 ran its course, the Fed’ balance sheet had swelled by 29.4%, and the S&P 500 had rallied about 25%.

But when the curtain came down on QE2, and Wall Street had no hints that an encore was imminent, the S&P 500 put in a wicked 16% sell-off between July and August 19.

So on September 21, 2011, Bernanke announced the implementation of “Operation Twist,” authorizing the purchase of $400 billion of long term Treasury bonds financed by the sales of shorter term bonds, thereby extending the average maturity of the Fed’s portfolio and lowering long term interest rates.

It was hoped that Twist would offer the benefits of QE without expanding the Fed’s balance sheet.

Once again the markets responded, rallying about 25% from the end of September 2011 to the end of April 2012. But when Operation Twist stopped twisting, another sell-off predictably ensued. From April 27, 2012 to June 1, 2012, the S&P dropped 9%.

So on June 20, 2012 the Fed extended Twist to the end of 2012, which sparked a summer rally that helped stocks regain all the losses from earlier in the year. But by September the rally slowed and another fall threatened. Perhaps the twisting wasn’t enough?

At this point I believe the Fed finally understood: No stimulus, no rally. And so on September 13, 2012, the Fed announced QE3, an open-ended commitment to purchase $40 billion agency mortgage-backed securities per month.

This eliminated the need for embarrassing QE re-launches every time the markets or the economy stalled. But the $40 billion monthly rate was apparently not enough to move stocks. From the time of the announcement to the end of 2012, the S&P declined about 2.3%.

So then on December 12, 2012 the Fed doubled the size of QE3 to $85 billion per month. The rest is history.

Since the launch of QE3, the U.S. has seen lackluster economic performance, a deteriorating geo-political landscape, and, somewhat incongruously, a nearly relentless stock market rally. By the time that QE3 ran its course last month the Fed’s balance sheet had expanded by another 63% (to $4.2 billion) and the S&P 500 had surged 36%.

Although the rally in stocks continued during the taper of QE, the rate of increase slowed along with the rate of balance sheet expansion. Full throttled $85 billion per month QE persisted from September 2012 to December 2013.

During that time, stocks rallied about 26%, and the Fed’s balance sheet grew by 45% to $3.7 trillion. Since the taper began (to the end of the program in October), however, the Fed’s balance sheet has grown just 12% (through October 22, 2014), with the S&P 500 virtually matching that with a 12% increase.”

Is That The Fed’s Job?

But the Fed has no obligation to boost stocks. According to the Fed:

Since 1977, the Federal Reserve has operated under a mandate from Congress to “promote effectively the goals of maximum employment, stable prices, and moderate long term interest rates” — what is now commonly referred to as the Fed’s “dual mandate.”

The idea that the Fed should pursue multiple goals can be traced back to at least the 1940s, however, with shifting emphasis on which objective should be paramount. That such a mandate may, at times, create tensions for monetary policy has long been recognized as well.

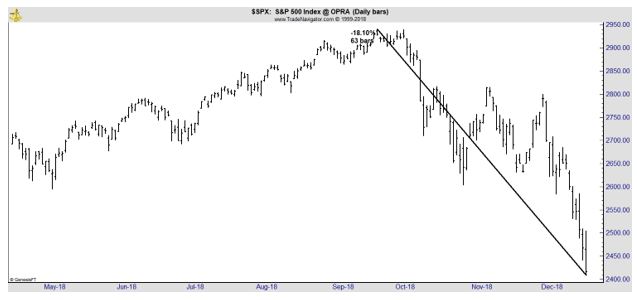
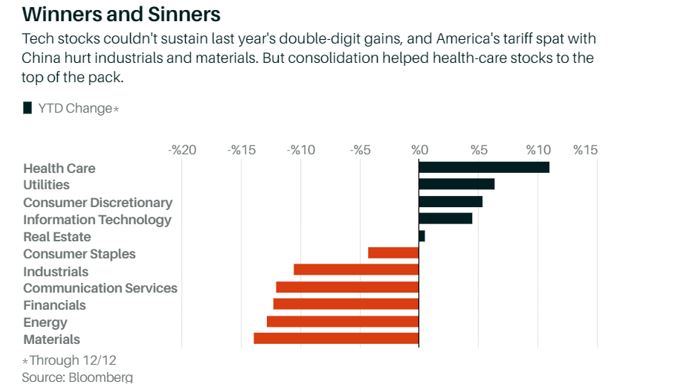
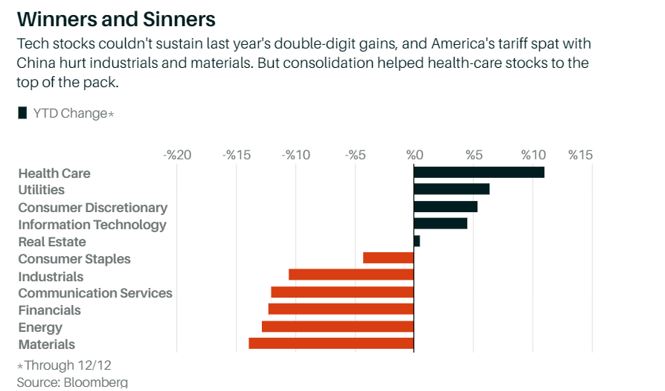
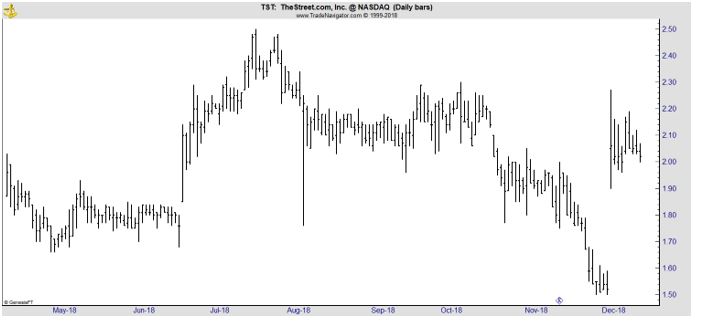
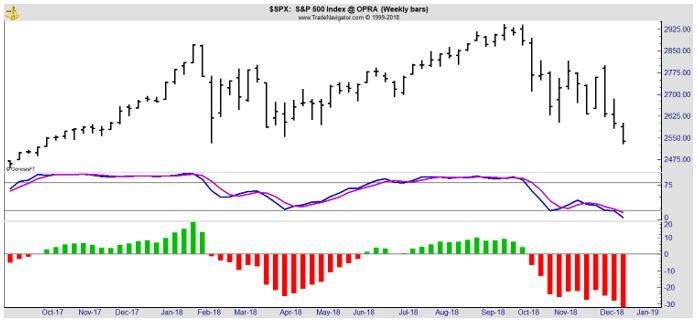
Now, with stocks falling, it is time to see if the Fed will support stocks again, as they appear to have done in the past. The chart below shows selling accelerated after the most recent Fed meeting.

S&P 500 index chart

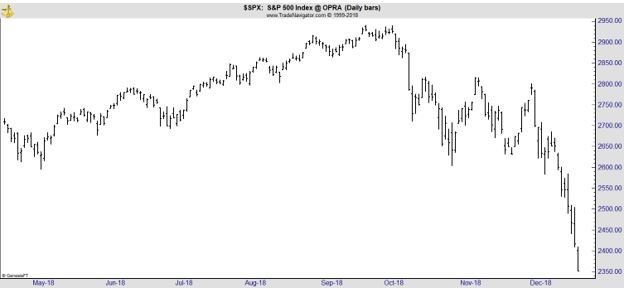
Stocks are down and prices of commodities, including oil, silver, and lumber, are all down significantly. According to Barron’s:

“When asked about these developments at his press conference…Federal Reserve Chairman Jerome Powell responded that “what we’ve seen here is a tightening.”

The concern among traders is that the Fed will add too much to this tightening and potentially push the economy into recession on the basis of backward-looking data.

New York Fed President John Williams corroborated this thesis when he said on Friday that the Fed is “ready to reassess and re-evaluate” its forecasts if there are “risks to that outlook that maybe the economy will slow further.”

Can the Fed Rescue Stocks?

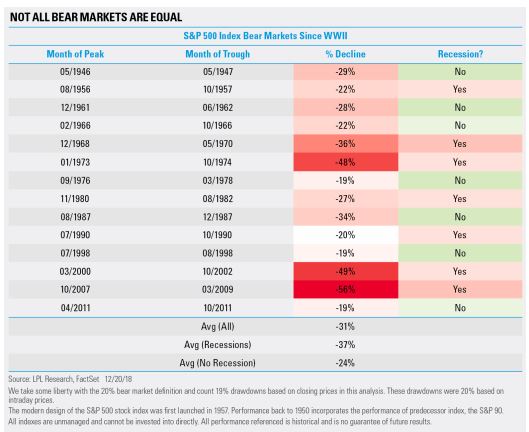
Right now, investors should consider that the Fed does not have any official responsibility for the stock market. Since 1987, Fed chairs have attempted to calm investors when prices have fallen. But there have been two steep bear markets in that time with prices falling more than 50% in 2008.

This demonstrates the Fed is powerless to stop bear markets. It also indicates the charts like ones showing how the Fed impacts stocks are likely overstating the case. Stocks, like the Fed, react to data and prices fall when the data is weak.

Right now, uncertainty is high and the economy appears to be slowing. This is a setup for a bear market and the Fed’s resources are limited. There is little chance the Fed can reverse the course of a bear market on its own.

That means investors should implement bear market plans instead of hoping for a Fed bailout.

Uncategorized

Bears Feed Off the Economy

As major stock market indexes fall to levels associated with bear markets, investors are considering an important question which is how far they could expect prices to fall. History shows the answer to that that could depend on the economy.

According to thebalance.com, “a bear market is when the price of an investment falls over time. It begins after prices have fallen 20 percent or more from their 52-week high.

The average length of a bear market is 367 days. The conventional wisdom says it usually lasts 18 months. Bear markets occurred 32 times between 1900 and 2008, with an average duration of 367 days. They typically happened once every three years.”

Refining the Definition of a Bear Market

There are other definitions of a bear market, some which more closely capture the experience of investors. The truth is waiting for prices to drop 20% can be devastating to an investor.

Imagine an investor who planned to retire at the end of 2018. The speed of the recent market move would have been potentially life changing since decisions would likely have been made to manage finances in the coming years.

S&P 500 index daily chart

While an investor expecting to retire within months might have decreased the risk of their portfolio, a large loss at the beginning of their retirement years changes things dramatically for some. It could mean lower than expected income, for example.

For that investor, a 15% decline could feel like a bear market, especially a rapid one. Because an investor’s perception of a bear market can be different than the standard definition of waiting for prices of major indexes to fall 20%, there are several other ways analysts define bear markets.

Among the most popular alternative definition is one provided by Ned Davis Research, a well respected firm. Their definitions of bull and bear markets are:

  • A Bull Market requires a 30% rise in the Dow Jones Industrial Average after 50 calendar days or a 13% rise after 155 calendar days. Reversals of 30% in the Value Line Geometric Index since 1965 also qualify.
  • A Bear Market requires a 30% drop in the Dow Jones Industrial Average after 50 calendar days or a 13% decline after 145 calendar days. Reversals of 30% in the Value Line Geometric Index also qualify. This applied to the 1987, 1990 and 1998 high and low.

This definition might be more meaningful to individual investors since an informal definition of a bear market could be a price decline that hurts, although the term hurts is not quantified and that would vary from investor to investor.

However, the Ned Davis Research definition captures declines that have unfolded since 2009 the more widely definition ignores.

bear market chart

Source: Almanac Trader

Notice how this definition includes the declines in 2011 and 2015. The chart of the Russell 2000 index shows that these time periods included declines of more than 20% in small cap stocks, just like the current period.

Russell 2000 index chart

Even if these were not official bears, they were significant to many individual investors. They also highlight an important distinction between bear markets. These two declines occurred while the economy was expanding and that seems to lessen the severity of market sell offs.

Bear Markets Vary With the Economy

Thebalance.com also notes, “Bear markets are accompanied by recessions. That’s when the economy stops growing and then contracts. That causes layoffs and high unemployment rates.” However, that is not always the case. There have been bear markets when the economy is expanding.

Analysts at LPL Research noted, “going back to World War II, we found there have been 14 bear markets, with seven taking place during a recession and seven without an accompanying recession.”

The analysis continued, “as the LPL Chart of the Day shows, the seven bear markets that accompanied a recession were quite painful, losing 37% on average.

On the flipside, non-recessionary bears weren’t as painful. Looking at the previous four, three of them ended at 19% corrections (reaching the 20% threshold intraday).

not all bear markets are equal

Source: LPL

While stocks fell 34% drop in 1987 without an accompanying recession, conditions were quite different than they are now. Remember, the S&P 500 was up more than 40% year to date in August 1987, so a potential violent snapback was likely.

“The bottom line is that you can have bear markets without a recession,” explained LPL Senior Market Strategist Ryan Detrick. “But, as we’ve seen over the past 40 years, if the economy is on firm footing, bears tend to stop around a 20% loss and the occurrences of a massive drop are quite limited.”

That means the depth of the current market sell off could depend on the state of the economy.

Arguments For the Bulls

While many analysts are concerned that a recession is possible, not all analysts expect the economy to slow that much. LPL Research sees both sides to the argument of whether bulls or bears will be in control of 2019. Their bullish case is summarized below:

Year to date, the S&P 500 is down 7.7%, yet earnings and gross domestic product (GDP) growth have been quite impressive, while stock valuations (price/earnings ratio, or PE) have compressed.

We previously saw stocks pause amid a strong economic backdrop with a drop in PEs in 1984 (real GDP 7.3% and earnings 21%) and 1994 (real GDP 4.0% and earnings +19%). Both 1985 (26% earnings) and 1995 (35% earnings) rebounded with strong S&P 500 returns. Could 2019 continue this trend?

Additionally, the midterm election year historically is the most volatile out of the four-year presidential cycle. In fact, since 1950, the S&P 500 in a midterm year has pulled back an average of 16.9%—the most out of the four-year cycle.

The good news? From the closing low in a midterm year, a year later stocks have been higher 17 of the last 17 times. Given the S&P 500 just made a new closing low this week, could this actually be a potentially good signal?”

In other words, there are reasons to believe the end of the decline is near. However, there are also reasons to believe that a bear market is just beginning, and the decline could take prices 40% or more below their all time highs if a recession begins.

No matter what an investor wants to believe, now is definitely a time for caution.


Uncategorized

2019’s Best Bet In Stocks

The end of the year is often a time for reflection. It is a time to look ahead. Both of those exercises can have value for investors. Reflection allows them to see what worked in the past year while looking ahead is an opportunity to develop a strategy.

For investors, the exercise can be especially useful if they apply momentum strategies in their portfolio.

Momentum investing, according to Investopedia, “involves a strategy to capitalize on the continuance of an existing market trend. It involves going long stocks, futures, or market ETFs showing upward-trending prices and short the respective assets with downward-trending prices.

Momentum investing holds that trends can persist for some time, and it’s possible to profit by staying with the trend until its conclusion. For example, momentum investors that entered the U.S. stock market in 2009 generally enjoyed an uptrend through 2018.

Momentum investing usually involves a strict set of rules based on technical indicators that dictate market entry and exit points for particular securities.

Momentum investors sometimes use two longer-term moving averages, one a bit shorter than the other, for trading signals. Some use 50-day and 200-day moving averages, for example. The 50-day crossing above the 200-day creates a buy signal. A 50-day crossing back below the 200-day creates a sell signal. A few momentum investors prefer to use even longer-term moving averages for signaling purposes.

Another type of momentum investing strategy involves following price-based signals to go long sector ETFs with the strongest momentum, while shorting the sector ETFs with the weakest momentum, then rotating in an out of the sectors accordingly.”

Another way to implement a momentum strategy is simply buy last year’s best performers and hold them for a year. Studies have shown this can be a successful approach to the markets.

Looking Back

The chart below shows the performance of various sectors in the past year. The chart shows that health care and utilities have been the best performers.

Winners and Sinners chart

Source: Barron’s

These two sectors are usually considered to be safe havens in a bear market and they have performed well in a difficult year for the stock market.

In MarketWatch.com, Mark Hulbert recently noted that the trend in utilities is not limited to the short term and the sector has been a strong performer over the long term as well:

“Over the last 20 years, for example, the Utilities Select Sector SPDR (NYSE: XLU) has beaten the S&P 500 index by an annualized margin of 6.7% to 6.0%. It’s extraordinary for stocks as conservative as utilities to nevertheless beat the broad market over the long term.”

While utilities have done well in the past, the question is how they look going forward.

A bullish analyst was recently quoted in Forbes explaining that there are misconceptions about utility stocks that investors should consider:

“Despite the persistent belief of many investors that dividend stocks are bond proxies, utility stocks over any meaningful period of time trade in line with their business prospects. And like all companies, they’re affected by the health of the economy and capital markets.

A return to rally mode for the overall stock market would therefore benefit utilities.”

While there are reasons for optimism based on the business prospects,

“Offsetting is the potential headwind of rising interest rates. Over any length of time that’s meaningful for income investors, there’s no real correlation between benchmark interest rates and utility stock returns.”

And, volatility can not be ignored in the sector:

“It also seems obvious that much of the resulting volatility is attributable to money sloshing in and out of giant ETFs, much of it in response to algorithms rather than individual human decisions. And that almost certainly means we can expect more of this kind of action.”

Overall, this analyst believes utilities should be viewed as companies rather than as a defensive asset class that moves independently of the stock market.

Putting Theory to a Test

Other analysts believe utilities are a defensive trade. A defensive investment strategy can be defined as “a conservative method of portfolio allocation and management aimed at minimizing the risk of losing principal.

A defensive investment strategy entails regular portfolio rebalancing to maintain one’s intended asset allocation; buying high-quality, short-maturity bonds and blue-chip stocks; diversifying across both sectors and countries; placing stop loss orders; and holding cash and cash equivalents in down markets.

Such strategies are meant to protect investors against significant losses from major market downturns.”

In order to be successful, a defensive strategy should deliver gains as the broad stock market falls. The next chart compares the utility sector index with the S&P 500 since the beginning of October.

utility sector daily chart

This chart shows that utilities have done well since the market decline began, delivering a gain as the S&P 500 index dropped almost 15%.

The next chart looks at health care and shows that this sector has lost less than the broad stock market but still shows a loss.

XLV daily chart

This is a short time period and the performance of the two sectors should be considered as conclusive. But the charts do demonstrate the potential value of utilities in the current stock market.

Yahoo Finance recently posted an analyst’s recommendation as to the best utility stocks. They were:

  • American Electric Power (NYSEL AEP): a massive electric utility company that delivers electricity to more than 5 million customers across eleven states. Hotter than normal weather so far in 2018 has buoyed operations for the past several months, and robust economic strength in the company’s core markets has also boosted the business. Overall, sales and earnings are both trending higher at a healthy rate. And the dividend yield on AEP stock is 3.5%.


  • Sempra Energy (YSE: SRE) is another one of the industry’s heavyweights is Sempra Energy (NYSE:SRE), the multi-faceted energy company that provides energy services to more than 40 million customers globally across Southern California, Texas, Chile and Peru. The company is continuing its energy diversification efforts by expanding its liquid natural gas (LNG) business, something which the company feels can help fuel sustainable long-term growth. The dividend yield on SRE stock sits right around 3%.


  • Duke Energy (NYSE: DUK) also benefitted from unusually hot weather and strengthening economic conditions, Duke’s revenues and earnings are trending consistently higher at a slow and stable rate and offers a 4.5% dividend yield.


  • American Water Works Company (NYSE: AWK) provides waters services to 15 million people across 46 states and Canada. That makes American Water the largest and most diverse publicly traded water company and yields 2%.


  • NextEra Energy (NYSE: NEE) offers significant long term earnings growth potential based on its role as a leading player in renewable energy and battery storage and offers a 2.6% dividend yield.

Given the current market environment, these could be stocks worth considering.


Uncategorized

Experts Tell Barron’s to Expect a Rally Next Year

It’s as much an annual tradition on Wall Street as the mistletoe in many homes on Main Street. Every year, Barron’s consults a group of Wall Street analysts to obtain their forecast for the next year. This year, all of the analysts are bullish in that none expect a down year.

To Summarize the Outlook:

“…as U.S. stocks stumble toward what could be their first yearly loss since 2015, next year is looking rather sunny. So say the 10 market strategists Barron’s consulted this month, all of whom have 2019 targets for the S&P 500 index that are higher than the benchmark’s recent price level of 2600.

Based on the group’s mean prediction, the S&P 500 will end next year at 2975, indicating a gain of more than 14%.

The strategists, who mostly hail from investment banks and asset-management firms, offered up individual S&P targets ranging from 2750 to 3100.”

So, should we buy based on these forecasts? Let’s dig a little deeper before logging in to our brokerage accounts.

Analysts Follow Trends

It’s important to remember that analysts prepare forecasts weeks ahead of release. They use data that is current at the time but that could change dramatically before publication and will almost certainly change dramatically over time.

Analysts also tend to make forecasts based largely on one of two assumptions – they either expect the trend to continue or they expect the trend to reverse. This might sound obvious but traders do the same thing.

As a short term trader, we might buy when prices cross above a moving average (MA) and sell when they fall below that MA. This strategy is based on the idea that we expect the trend to continue.

If we use momentum indicators like RSI as a short term trader, we might sell when the indicator rises to a high level. In that case we are expecting the trend to reverse.

Forecasting almost always relies on one of those two basic concepts. That might explain why analysts expected prices for the S&P 500 to increase this year. Barron’s notes “…they expected the S&P 500 to rise 7% this year.”  

For 2018, analysts largely expected a repeat of 2017 and did not “anticipate renewed volatility or any correction in the index, defined as a drop of 10% from the high. Overall, they predicted that financial stocks would do well in 2018 and that utilities would underperform, but the opposite has happened.”

The chart below summaries the performance of individual sectors and shows utilities outperformed while financials were among the worst performers.

winners and sinners

Source: Barron’s

Given their track records, it might seem that we don’t need to be concerned with analyst forecasts but that would be a mistake. Analyst forecasts summarize the consensus thinking on Wall Street in some ways and it is valuable to understand the expectations of investors.

Specific Forecasts

Several analysts expect the S&P 500 to reach 3,100 next year. Among the bulls is Dubravko Lakos-Bujas, the chief U.S. equity strategist at J.P. Morgan. He notes,

“The past week saw a “de-escalation” of trade and interest-rate concerns, notes Dubravko Lakos-Bujas, J.P. Morgan’s chief U.S. equity strategist, whose 2019 market target is 3100.

Talk of a trade war “was becoming increasingly risky for the Trump administration,” he says, noting the market’s negative response to rising trade friction.

If the economic cycle remains intact, Lakos-Bujas thinks that stocks will be rerated higher. He estimates that S&P 500 companies will earn $178 next year. Applying a multiple of 17.4 gets him to a target price of 3100.”

His specific forecasts are shown below.

JP Morgan forecasts

Source: Barron’s

The current yield on Treasuries is about 2.8% so this represents a significant increase in interest rates. The Federal Reserve changed their forecast for 2019 and now expects just two rate hikes instead of three so this could be an indication that data is changing rapidly as forecasts are being prepared.

On the other end of the spectrum is Mike Wilson, chief U.S. equity strategist at Morgan Stanley, who is “less sanguine about the market’s prospects and the economy.

Sharps, whose 2019 target is 2850, describes a “middling environment with meaningful challenges” for stocks, as U.S. growth moderates. Sustainable economic gains above recent levels depend on productivity improvements, he says.

Governments around the world have a lot of debt, and demographics in Europe and China could pose difficulties for growth, he adds.

Wilson’s base-case S&P 500 target of 2750 is the strategist group’s lowest. He forecasts just 3% to 4% growth in corporate earnings for 2019, with an “elevated risk of an outright earnings recession”—two quarters of negative comparisons for S&P 500 profits.

He notes that more than half of this year’s profit gain owes to tax cuts and stock buybacks, which reduce share count and boost earnings per share.

The economy might undergo a modest cyclical correction in 2019, but “what if companies react and start firing people?” he asks. In other words, investors could be underestimating the potential severity of the economic deceleration.”

His specific forecasts are shown in the next chart.

Morgan Stanley Forecasts

Source: Barron’s

Looking At Sectors:

“Utility stocks fetch 19 times expected earnings, although the sector offers much less growth than tech. Still, utilities are favored by several strategists, including Sharps of T. Rowe Price, and Wilson of Morgan Stanley.

Both like NextEra (NEE), which has a good rate base in Florida and a rapidly growing national renewable-energy business.

Consumer-discretionary stocks are least liked by our crowd. Consumers could pull back on spending, due to concerns over tariffs and the impact of a slower housing market, Nuveen’s Malik observes.

Within the sector, bricks-and-mortar-oriented retailers face an ongoing challenge, and will have to continue spending heavily to compete online.”

Now that we know the forecast there are ways to use this information. It will be important to maintain low expectations for next year. The earnings forecasts are likely to come down over time as they usually do and that could lead to lower prices.

Utility stocks could well be among the best performers in a volatile market. That could be important for investors to remember. While we don’t know the prices for the end of 2019 yet, we should expect a volatile year in the market as the Fed continues to drive the news cycle.


Uncategorized

Insiders and Institutions Love These Cheap Stocks

We can think of stock market investors in terms of groups. Some groups in that structure know more than others. Two groups that seem to know the most are insiders and institutional investors managing large accounts. Fortunately, individual investors can learn from those groups.

It’s important to recognize that information asymmetry exists in the financial markets. Potential investors have only limited information about a company. The only information generally available to investors is the information management chooses to disclose.

Management does disclose a great deal of information, but some information is kept secret. This could include business plans that provide a competitive edge to the company. Management will always know more than investors.

Because of this, Congress passed a law requiring corporate insiders, defined as the company’s officers and directors along with beneficial owners of more than 10% of the company’s stock, to report any changes in ownership.

This rule has been in place since 1934 when Congress passed the Securities Exchange Act of 1934. The Securities and Exchange Commission (SEC) have updated the rules over the past 70 years and forms are now available immediately to investors over the internet.

Insiders are required to report their transactions in a timely manner, generally within two days of the transaction.

Now, remember, no one knows a company better than an insider. When an insider makes a purchase, they are committing their personal funds to invest in the company. They may be acting on information they have access to that is not yet publicly available.

Institutional investors are also required to report holdings. They have an edge because their portfolios are so large that they can often afford more extensive research than individual investors. There are now reports, for example, of analysts using drones to determine foot traffic at retail stores.

Congress also required these investors to report their filings and among the filings large investors must make is SEC Form 13F, more formally called the Information Required of Institutional Investment Managers Form.

The 13Fs must be filed once a quarter by any investment manager with at least $100 million in assets under management. By law, 13Fs must be filed with the SEC within 45 days of the end of a quarter. For example, forms must be filed by February 15 for the quarter which ends December 31 each year.

By itself, the 13F filing can be confusing. An extract of one recent filing is shown below:

Form 13F table

In order to be useful, the information from the 13F needs to be collected and analyzed in some way. When the information is moved into a sortable database, we can determine what the filer is buying and selling.

We can even combine the filings to see which stocks are favored by hedge fund managers as a group. This information can be used to develop a trading strategy that follows the funds, but without the steep fees.

The same is true of insider activity where data aggregation can be beneficial.

Using the Data in the Filings

To sort through the data, there are expensive services available. But there are also free tools. We recently used the free screening capability at Finviz.com to search for companies with positive insider and institutional activity.

To narrow the list of investment opportunities that could be the subject of further research, we added additional filters.

It is near the end of the year and some investors will be realizing losses for tax purposes. This can create additional selling pressure and further reduce the price of the stock. To limit the impact of this risk, we looked for stocks that are down since the beginning of the year. This indicates loss selling could already be completed.

To increase the possibility that tax loss selling is completed, we also required the stock to be up in the past month. This indicates there has been interest from buyers in what has been a bruising market decline over that time.

Finally, we focused on cheap stocks. We limited the screen to stocks trading under $5.

Finviz screening tool

Source: Finviz.com

Just seven stocks passed this screen. The list is shown below.

7 stocks to trade

Source: Finviz.com

This list could serve as a starting point for additional research. Or it could serve as a complete portfolio strategy.

To apply screens like this as a complete strategy, it is important to remember that there is no assurance any stocks will deliver returns. Therefore, it could be best to buy all stocks that pass this screen.

The second important consideration if this is to be used as a complete strategy is the idea of selling.

An investor could use profit targets and stop loss rules. For example, the stock could be sold if it gains 50% as a potential profit taking rule and sold if the stock drops by 20% or below the buy price as a possible stop loss rule.

Another sell strategy is to rerun the screen periodically. The period could be as short as one month although three months, six months or one year periods could prove to be more profitable since the gains would have more time to accrue. A stop loss could be combined with this strategy.

Under this strategy, the new screen would show which stocks met the screen criteria at that time. If a current holding fails to meet the criteria, it could be sold while new stocks would be added.

That highlights a quantitative, unemotional way that individual investors could make investment decisions. They could run screens to determine what to buy and sell stocks they no longer meet the buy criteria.

This simple approach could remove the emotional aspects of investing decisions and prevent investors from buying based on tips or selling based on panic. There would be strict rules about what and when to buy and also strict rules defining the sell decision.

Tools like this could provide the solution for many investors to improve their returns providing they develop strong screens based on sound criteria and follow their rules with a disciplined approach for the long run.

This particular screen also places individual investors on the same side as the large investors and insiders in the market, potentially providing them with an edge to boost returns.


Uncategorized

Four Warren Buffett Stocks Trading Under $3

Let’s face it. We all want to invest like Warren Buffett. Buffett is a great investor who now benefits from his unique position in the investment community. When Goldman Sachs needed money during the financial market meltdown of 2008, they called Buffett offering a 10% dividend on his $5 billion investment.

Goldman created a special class for Buffett to invest in and gave him the option to buy shares of common stock at a discount in the future. That’s one of the ways Buffett is unique – he is able to complete deals no individual investor will ever be able to participate in.

We Can Do More Than Buffett Can

But we have an advantage over Buffett in some ways.

Let’s say Buffett found a great insurance company with a market cap of $400 million. That’s less than 0.01% of the value of his investment portfolio. If the insurer does great and doubles in value Buffett would increase the value of Berkshire Hathaway by less than 0.01%.

More realistically, let’s say he gets a 20% return on his investment. That increases his portfolio value by $80 million or less than 0.002%. 

Buffett made $500 million a year in dividends on his Goldman investment and earned an estimated 50% on his investment over 5 years by exercising the option he had. This is the kind of return he needs to continue growing Berkshire and given that requirement, he simply can’t look at small caps.

This is where we, as individual investors, have an advantage over Buffett. We can buy small cap stocks because 20% gains mean a great deal to us. One way to exploit this advantage is to study Buffett’s deals and apply his valuation principles to small caps.

Finding Stocks Buffett Can’t Buy

We could quantify the kind of stock we believe Buffett likes. In the letter to shareholders he writes every year, Buffett has mentioned that he measures management with an accounting tool called return on equity (ROE).

This is the ratio of net income to shareholders’ equity. ROE measures the percent of profit management is earning with the money shareholders invested in the company. ROE can vary by industry so a detailed analysis is usually needed to understand how well management is performing relative to its peers.

For our purposes, we are looking for the best small caps so we will require companies to have an ROE of at least 15%. This level is better than the ROE reported by about 70% of all publicly traded companies. This limits our search to the best management teams in the country.

We could also require the company to have a higher than average return on assets and a reasonable price to cash flow ratio. By requiring a reasonable ration, we are eliminating stocks with very low valuations that could be headed towards bankruptcy.

One way to find stocks meeting these requirements is with the free stock screening tool available at FinViz.com. At this site, you could screen for a variety of fundamental factors, high levels of institutional ownership and bullish institutional transactions Or, you could just screen on new highs. An example is shown below.

Finviz stock screener

Source: FinViz.com

For this screen, we selected stocks that Buffett might like and that are too small for him to realistically take a significant stake in.

This screen is a reasonable starting point for additional research. There is no guarantee any of these stocks will deliver gains and risk should always be considered. It’s also important to remember that screens like this will not identify unique risk factors.

Stocks passing the screen are shown below.

4 stocks from screening tool

Source: FinViz.com

Tengasco (NYSE: TGC) is thinly traded but prone to make large moves.

TGC daily chart

A stock like this could be bought and sold by aggressive traders looking for small gains. For example, a buy could be made and immediately after that order is filled, a profit taking sell order could be entered. If the stock spikes higher, as it has in the past, a strategy like that could deliver gains.

180 Degree Capital (Nasdaq: TURN) is in a down trend.

TURN daily stock chart

TURN operates as a business development company. The company’s investment objective is to achieve long-term capital appreciation by making venture capital investments.

The company specializes in making investments in companies commercializing and integrating products enabled by disruptive technologies mainly in the life sciences industry and provides operational and management resources, and financial solutions to such companies.

Its investment portfolio includes publicly traded and privately held companies. The Company has focused its investments on transformative companies in precision health and medicine.

If an investor is interested in a company like this, they would need to obtain TURN’s portfolio listing and evaluate the companies on that roster. TURN’s future returns could be heavily dependent on its investments and that will require research to evaluate.

TheStreet.com (Nasdaq: TST) is the well known financial information site.

TST daily chart

This stock has been trading since the internet bubble and never recovered to its initial public offering high.

TST quarterly chart

But revenue is steady and cash from operations is positive. This could be a brand that a larger media company would like to acquire given its dedicated reader base and proven ability to attract internet traffic.

The fourth company on our list is AEterna Zentaris Inc. (Nasdaq: AEZS).

AEZS stock chart

This is a volatile biotech company with two principal product candidates — Zoptrex (zoptarelin doxorubicin) and Macrilen (macimorelin) in oncology and endocrinology.

Both products are in Phase III clinical development. AES also has a luteinizing hormone-releasing hormone (LHRH)-disorazol Z conjugate (AEZS-138), which is in pre-clinical development in oncology and is available for partnering. The company did report a large jump in revenue in the past twelve months.

These stocks could all deliver significant gains or could all prove to be worthless. That is the risk of any investment but the potential gains in small cap stocks can be large while the potential risks are limited to the price paid at the time of purchase.

Each of these stocks, in particular, could be worth additional research since they display at least one quality Buffett could look for.


Uncategorized

This Could Be the First Signal of a Market Bottom

For now, it seems safe to say that the stock market is in a down trend. But the beginning of that trend appeared rather suddenly and caught many analysts and investors off guard. Many had been expecting the up trend to continue.

But the up trend did not continue and now it is time to consider when the down trend will end. Forecasting the reversal of a trend can be difficult to do. Yet it can be profitable for investors to try to forecast the end of the down trend.

Forecasting the reversal doesn’t require the trader to take action. In fact, taking action too soon can be costly. Perhaps the most famous example of calling for the end of a trend too soon is the internet bubble. Many investors saw that stocks were overvalued, but they became more overvalued.

At the time, news reports like the one below from the Guardian, questioned the wisdom of older managers and there were many who wondered whether or not older investors could adapt to the new environment:

“George Soros, the financier and philanthropist who took on the Bank of England and won, has lost $700m (£437m) betting against internet firms – the fledgling titans of the new industrial revolution.

Quantum, the flagship fund of the world’s biggest hedge fund investment group, is suffering its worst ever year after a wrong call that the “internet bubble” was about to burst.

This followed an equally disastrous wager that the euro would be a strong currency.

These losses, during a roaring US bull market, have called into question the management of huge, powerful hedge funds, which use vast amounts of money to speculate on market movements. Tiger, the world’s second biggest hedge fund group, also revealed yesterday that it has lost about $1bn (£625m) since the beginning of the year.

The Soros group of funds has fallen from a peak of $22bn (£13.7bn) last year to $13bn (£8bn) because of bad investment decisions and money withdrawals by nervous investors. Most US stock markets have achieved double digit percentage gains during the same period.”

Of course, Soros recovered. But losses of that size could doom many smaller investors.

Turn to the Charts

Being early in calling for the end of a trend often relies on fundamentals. It could be more helpful for analysts to turn to charts and indicators when looking for trend reversals.

Many traders look for divergences between indicators and prices. A divergence occurs when the indicator, often a momentum indicator, changes the direction of its trend or shows signs of a weakening trend before the reversal in prices.

Traders use momentum indicators like MACD to confirm price trends. Formally, MACD is the Moving Average Convergence-Divergence indicator. It’s been available to traders since at least the 1970s when Gerald Appel began writing about it. The indicator is most commonly viewed as a series of bars, like the ones shown below prices in the charts highlighted below.

If both prices and momentum are rising, they expect momentum to keep pushing prices higher. When momentum slows, they watch for a reversal in the price trend.

A bearish divergence is seen on a chart when prices reach a new short-term high, but a momentum indicator fails to reach a new high. Traders tend to believe that momentum will change directions before price and if momentum weakens, price weakness should follow soon.

The chart below shows an example of a bearish divergence that formed during the internet bubble.

QQQ weekly chart

The MAD indicator is at the bottom of the chart and it was reaching a lower high as prices in the Invesco QQQ Trust ETF (Nasdaq: QQQ) were peaking. QQQ is an index that tracks the tech heavy Nasdaq 100 index and was among the biggest winners in the bubble.

The divergence offered the first warning that the trend was about to reverse. At a bottom, investors should be watching for a bullish divergence. The one shown in the next chart was significant and obvious on the chart and signaled the impending end of the bear market in 2009.

S&P 500 weekly chart

This is a chart of the S&P 500 index. Prices bottomed in March 2009 but MACD was moving higher after recording a significant low in October 2008. That was a signal that the rally that began in march 2009 was important and tradable.

The Current Market

Divergences can be found in other indicators besides MACD. Any momentum indicator could deliver a divergence signal. The chart below shows the current status of MACD and stochastics on the S&P 500.

S&P 500 weekly chart

Stochastics, according to one analyst can be described in simple terms, “Stochastics measures the momentum of price. If you visualize a rocket going up in the air – before it can turn down, it must slow down. Momentum always changes direction before price.”

The same idea applies to a golf ball, which many of us are more familiar with. The gold ball flies off the tee and arcs higher, at least when the pros do it on TV. The ball levels off and as it does its momentum slows.  Then, it begins to fall and its momentum accelerates to the downside.

Stochastics, and other momentum indicators, apply this idea to prices. Technical analysts generally believe that a close near the high is bullish and a close near the low is bearish. Stochastics quantifies this belief with the formulas used to find the two lines.

In the chart above, the one of the S&P 500 right now, both stochastics and MACD are driving to new lows. This is consistent with the price action which is also pushing to new lows. The fact that both momentum and price are moving lower indicates that this is a strong trend.

The strong down trend will eventually give way to an up trend. But traders should consider implementing and following their bear market plans as long as the trend remains down. They should also consider letting the market action show that a bottom is in place before turning bullish.

A divergence will highlight the potential end of the down trend. A short series of higher highs will confirm that the trend has most likely reversed. That will be the time to buy aggressively and it appears to be weeks or even months in the future.


Uncategorized

Surprise: This Could Be Your Best Retirement Investment

Many of the things we think we know about investing are wrong. But we do know one thing with near certainty. The answer to almost every question is “it depends” and that is true even when we think we know the answer.

For example, there is a very unpopular investment that could actually be right for you according to a number of very talented economists. But this investment is absolutely wrong for many investors. Let’s start there.

You probably don’t need this investment if you have a pension that, along with Social Security, meets most of their retirement income needs or you are wealthy enough to not be worried about running out of money, even if their retirement exceeds 50 years. That’s the conclusion of York University finance professor Moshe Milevsky.

A Long History Explains the Value

You may have heard the stories of how groups of veterans from both World Wars and other made pacts during their service. They would give a bottle of whiskey or some other valued prize to the last survivor. These were an example of a tontine.

This concept, according to Blair duQuesnay of Ritholtz Wealth Management, “is older than the stock market. In the late 17th century, an Italian banker living in France, developed a scheme that paid annual dividends to a pool of investors.

As individuals in the group died, the surviving members received the deceased member’s share of dividends. The scheme was named a tontine, after the banker whose name was Lorenzo de Tonti. Modern insurance companies are following a similar structure by selling annuities pools of investors.

Each individual stands to receive a higher lifetime income than they would from a standalone investment because some investors in the pool will die sooner, creating what are called “mortality credits” for the rest of the pool.

For this reason, annuities could play a key role in solving the looming retirement crisis in America, but only if done without the conflicts of interest inherent in the sales commission distribution method.”

That last part is very important. There are conflicts of interest possible in these products which can pay very large commissions. The commissions are often built into the product’s price and are therefore less transparent than other costs associated with financial products.

But the idea is very old and was patented in 1792.

patented in 1792

Source: Public Domain, https://en.wikipedia.org/w/index.php?curid=24553216

Why This Idea Could Make Sense

Barron’s recently explained why the idea of an annuity could be worth considering:

“Income annuities…haven’t been popular outside of policy and academic circles. They account for just 5% of the $203.5 billion in total annuity sales last year, according to LIMRA Secure Retirement Institute.

Mention annuities and people think complexity, opacity, and high costs. That’s in large part because the more popular annuities offer variable (rather than set) income, and come with enticements like guaranteed minimum benefits, payouts linked to an index, or cash refunds—perks that can carry a high cost.

Yet, when a long list of academics—including behavioral economist and Nobel Prize winner Richard Thaler—talk about the merits of annuities, they are referring to no-frills, fixed-income annuities.”

Thaler has made a career and won a Nobel prize for studying why investors take actions against their own best interests. His work is always worth studying.

Thaler photo

Source: University of Chicago

Professor Milevsky recommends “buying into a qualified longevity annuity contract, or QLAC. These typically pay out at age 85 and can be bought inside tax-deferred accounts, such as 401(k) plans, allowing investors to benefit from low-cost institutional pricing.”

Less than 10% of 401(k) plans, however, offer any sort of annuity option, according to an annual survey by the Plan Sponsor Council of America. If it’s not on your menu of options, Milevsky recommends talking to a plan sponsor or administrator, and/or buying it through an individual retirement account.

Most retirement experts recommend putting no more than a quarter of savings into an income annuity. It’s also worth talking to a financial advisor on whether to use pre- or after-tax income to purchase them; each potential buyer’s situation is different.

A deferred income annuity offers the most for your money because it affords a bigger payout from “mortality credits.” These accrue as insurers pool assets of investors, some of whom will die before receiving any income.

Milevsky recommends beginning to buy the initial tranche of annuities—say about $50,000 worth—10 or 15 years before you might need to draw on the income, and purchasing more as needed, as you find yourself spending more or are in better health than you anticipated.

“That way, you learn the sweet spot of what you need. As retirement evolves and you realize you are spending more than you thought, you can get more [coverage],” Milevsky adds.

Several carriers, including Nationwide, AIG, and Lincoln Financial Group, offer low-cost, simple income annuities. Pricing varies but currently low-cost or institutionally-priced simple annuities can pay out 6% more, on average, and that is more than is available in fixed income investments with less risk than in the stock market.

Barron’s provided an example:

“Currently, a 65-year-old man can buy a $50,000 deferred single life income annuity that pays out $605 a month, starting at 75 ($562 for a woman).

Buying that annuity at 55 and having it start at 80 would more than double the payout to $1,257 a month for the man and $1,140 for the woman, according to the Hueler Cos.

Typically, the most basic annuities offer the biggest payouts.

 At the moment, a 55-year-old can get $1,380 in monthly income, starting at 80 and also get an extra 10-year-fixed feature that allows for his beneficiary to continue getting the monthly payment if the annuitant dies within 10 years of the payment starting.

Such deals are one reason Hueler recommends shopping around frequently, noting that prices change based on an insurance carrier’s book of business at any given point.”

Now, this may not be the best investment option for you. Even if an annuity is right for you, there are many products available that are not right for you. Buying an annuity requires research and the ability to find the lowest cost and best returns. But, the effort could be worth the price.


Uncategorized

How to Think Like Warren Buffett

Warren Buffett is an investing icon and there is a good reason for that. He has been amazingly successful and he leaves the impression that individual investors could duplicate his success. This is not true for other professional investors.

Many investment managers, in all honesty, pursue strategies than an individual cannot duplicate. Activist investors, for example, buy large stakes in companies and then advocate for changes that will unlock share holder value.

A famous example of investor activism is the story of Darden Restaurants, the parent of Olive Garden. By October 2014, Starboard Value, an activist firm challenged the board and zeroed in on a set of changes to improve food quality, diner experiences, and streamline operations in kitchens.

Grabbing headlines, Starboard began by suggesting improvements in Olive Garden’s approach to its signature breadsticks. The company’s policy had been to serve each customer one breadstick (plus one). According to Vanity Fair,

“But this rule was rarely followed and barely enforced, which often led to the once-fresh carbs turning to rocks as they sat uneaten on tables across the country. Starboard, the Journal reports, suggested that Olive Garden could save up to $5 million each year just by sticking to the breadstick guidelines.

Darden also sent Olive Garden chefs to a breadstick conference in Hollywood, Florida, where they dissected what goes into crafting the perfect breadstick: the right amount of salt, how much butter would be just enough but not too much, what technique would produce the most golden, flaky finished product, etc.”

food waste chart

Source: Newsday

Individual investors generally lack the resources to invest like this. The same could be true of many quantitative strategies or even broad value and growth approaches. That could be why many individual investors look to the wisdom of Buffett.

Look Ahead to Find Good Investments

Buffett is older now and he has hired other investment managers at his company, Berkshire Hathaway. That means there is really no way to know if Buffett is making the buy and sell decisions of any current Berkshire Hathaway investment. To study Buffett, it could be best to consider past investments.

But, Buffett himself, looked ahead when he began to evaluate a potential buy. According to Behavioral Value Investor, at a dinner more than a decade ago, Buffett said that when evaluating a potential investment,

“First he decides whether he can roughly estimate the business’s key economic characteristics 5–10 years out. If he can’t then he eliminates it from consideration right then and there.”

Many individuals could consider this approach as a way to evaluate investments. If they did so, they could avoid many potential investment disasters.

Applying Buffett’s Ideas

Thinking about a business’s key economic characteristics 5-10 years out will significantly reduce the number of investment options for many individual investors. It will require understanding the business. 

That might seem like a disadvantage at first.

It could limit investors to stocks like Coca Cola (NYSE: KO).

KO quarterly chart

This is a company that is easy to understand. They make soft drinks. Their brand is known around the world. Their product is available and is the same all around the world. Simple, in this case has turned out to be a good investment.

Thinking about a business’s key economic characteristics 5-10 years out could cause investors to miss out on stocks like Cisco Systems (Nasdaq: CSCO) in its early years.

CSCO quarterly chart

Cisco makes routers that make the internet possible. In the late 1990s, Microsoft was responsible for providing the software with Windows that established standards. Intel defined the standard for hardware at that time. Cisco connected the world.

But in 1999, there weren’t many investors who truly understood the technology. Homes were served by modems rather than routers and the promise of the internet was a large part of the allure of the stocks. Not understanding technology but hoping for the best, a bubble developed.

Investors who were following Buffett’s advice and being perfectly honest with themselves would have most likely avoided the bubble.

But, ten years later, these same investors might have developed an understanding of routers and connectivity. The technology was now in their homes and they might also have seen Cisco voice systems in their offices. They might have a better understanding about the potential in the future.

And, they could have bought when they understood what the future could possibly look like.

Limiting, or Profit Maximizing?

The central question of whether or not Buffett’s advice could be followed lies in how an investor feels about accepting limits on their thinking. This could prevent many investors from buying into the technology sector.

Analysts frequently note that “Buffett has often said he avoids investing in the technology sector because he does not like to own stocks in companies whose business he does not understand. Even during the dotcom boom, Buffett shied away from buying stock in hot internet companies.”

Despite his refusal to participate in what many investors believe is the most promising sector of the stock market, Buffett has done well. In fact, he may be the greatest investor in history. And, that point can be very important to consider.

As individual investors, we often plunge in to stocks that we have little understanding of. The story might sound promising or the sales rep could make a compelling case for the technology. Meanwhile, we walk past the cans of Coke in the store that have been stocked on shelves since our grandparents’ day.

Buffett has made a fortune by noticing what’s on the shelves around him and taking time to understand the companies he invests in. This step could prevent large mistakes and keep individual investors out of the bubbles that form in markets.

This philosophy could have helped many investors avoid bitcoin and cryptocurrencies, for example. These are markets that are likely to have some type of key economic characteristics 5-10 years out. But, even in the bubble, experts argued about what the future held.

That was an indicator the market carried risk. Buyers were hoping the best case scenarios would come to pass without even being able to articulate what the best or worst case was. Buffett, of course, would not participate in markets like that.

This could be an important lesson for all of us. Know what we are investing in before we buy.

Uncategorized

Do-Good Investors Looking to Pot Stocks

Some investors are not worried about maximizing profits. Instead they seek to maximize gains consistent with their values. This investment framework goes by several names including Socially Responsible Investment, or SRI.

SRI is defined by Investopedia as “an investment that is considered socially responsible because of the nature of the business the company conducts.

Common themes for socially responsible investments include avoiding investment in companies that produce or sell addictive substances (like alcohol, gambling and tobacco) and seeking out companies engaged in social justice, environmental sustainability and alternative energy/clean technology efforts.

Socially responsible investments can be made in individual companies or through a socially conscious mutual fund or exchange-traded fund (ETF).

“Socially conscious” investing is growing into a widely-followed practice, as there are dozens of new funds and pooled investment vehicles available for retail investors.

Mutual funds and ETFs provide an added advantage in that investors can gain exposure to multiple companies across many sectors with a single investment. Investors should read carefully through-fund prospectuses to determine the exact philosophies being employed by fund managers.

There are two inherent goals of socially responsible investing: social impact and financial gain. The two do not necessarily go hand in hand; just because an investment touts itself as socially responsible doesn’t mean that it will provide investors with a good return.

An Investor Must Still Assess The Financial Outlook Of The Investment

One example of socially responsible investing is community investing, which goes directly toward organizations that have a track record of social responsibility through helping the community and have been unable to garner funds from other sources, such as banks and financial institutions.

The funds allow these organizations to provide services to their communities, such as affordable housing and loans. The goal is to improve the quality of the community by reducing its dependency on government assistance such as welfare, which in turn has a positive impact on the community’s economy.

As awareness has grown in recent years over global warming and climate change, socially responsible investing has trended toward companies that positively impact the environment by reducing emissions or investing in sustainable or clean energy sources. Consequently, these investments avoid industries such as coal mining due to the negative environmental impact of their business practices.”

One way to implement an SRI strategy is to sell off existing holdings that do not meet the requirements.

This is known as divestment, also known as divestiture and is the opposite of an investment. It is the process of selling an asset for either financial, social or political goals. Assets that can be divested include a subsidiary, business department, real estate, equipment and other property.

Divestment can be part of following either a corporate optimization strategy or political agenda, when investments are reduced and firms withdraw from a particular geographic region or industry due to political or social pressure.

Often, SRI involves avoiding tobacco stocks. But it doesn’t always mean avoiding smoking in a technical sense. In fact, some SRI funds are buying marijuana stocks.

According to Barron’s, California Public Employees’ Retirement System, the biggest pension fund in the U.S., won’t invest in tobacco companies. But apparently it doesn’t have an issue with marijuana producers.

The fund’s third-quarter filing of holdings to the Securities and Exchange Commission shows that it has a small position in Tilray stock (Nasdaq: TLRY).

As of Sept. 30, the pension fund, commonly known as Calpers, owned 1,617 shares of the Canadian maker of cannabis for medical and recreational adult use. Canada legalized recreational marijuana use in October, and Tilray’s initial public offerings in the U.S. and Canada were in July.

“In 2000, Calpers sold its positions in tobacco stocks and imposed a limited ban on investing in tobacco-related companies. Recently, the fund estimated that it missed out on $3 billion in returns through 2014 because of that decision.”

The chart of Altria Group (NYSE: MO) shows an example of the consequences of the decision.

MO monthly stock chart

That’s money Calpers could have used: As of last year, it had a $138.5 billion unfunded liability.

The decision to avoid tobacco was not without controversy.

“In December 2016, Calpers’ staff recommended removing all restrictions against investing in tobacco, citing the fund’s “current circumstances as a mature, cash-flow negative pension plan with increasing demands on investment returns to fund benefits.”

Despite the recommendation, Calpers’ staff recognized “negative societal implications of tobacco, with the primary negative externality being the health implications of using the product and the related costs across society.”

Calpers spokeswoman Megan White told Barron’s in an email that “concerns over ongoing litigation and regulatory risks facing the tobacco industry prompted the Investment Committee to divest.”

This Demonstrates That SRI Is A Challenge

When asked why Calpers is investing in marijuana stocks while it shuns the tobacco sector, White wrote, “The board does not make decisions about buying stocks. The investment office has delegated authority.”

In other words, there is no clear answer on what should and should not be a socially responsible sector or company.

The best answer is for investors to consider their own personal preferences. If you believe global warming is a significant threat to the future, it could be satisfying to avoid oil stocks and traditional energy companies.

Some investors will find they disagree with a particular political system and will want to avoid investments in a particular country. This strategy can deliver results in the form of change according to some experts.

One example is the divestment from South Africa which was first advocated in the 1960s, in protest of South Africa’s system of apartheid, but was not implemented on a significant scale until the mid-1980s.

The disinvestment campaign, after being realized in federal legislation enacted in 1986 by the United States, is credited by some as pressuring the South African Government to embark on negotiations ultimately leading to the dismantling of the Apartheid system.

This demonstrates investors can make a change in policies. But the first step, as it in so many cases, is to take action. It is similar to the farm to table movement or the “think globally, act locally” philosophy that can make a tremendous difference.