Stock market strategies

You Might Be Like a Professional Investor, And That’s Bad

Many professional investors spend all day deciding which stocks to buy and sell. That’s their job. Many individual investors have a job outside of the markets and dedicate just a portion of their time to making decisions about when to buy and sell.

One of the more surprising papers published recently highlights how professional managers might make their sell decision and the results are startling. It turns out there may not be as much thought behind the sell process as there is to support the buy decision process.

Data Paints an Interesting Picture

In the paper, Selling Fast and Buying Slow: Heuristics and Trading Performance of Institutional Investors, the researchers found that there may not be a strictly defined process for when to sell”

“Most research on heuristics and biases in financial decision-making has focused on non-experts, such as retail investors who hold modest portfolios. We use a unique data set to show that financial market experts – institutional investors with portfolios averaging $573 million – exhibit costly, systematic biases.

A striking finding emerges: while investors display clear skill in buying, their selling decisions underperform substantially – even relative to strategies involving no skill such as randomly selling existing positions – in terms of both benchmark-adjusted and risk-adjusted returns.

We present evidence consistent with limited attention as a key driver of this discrepancy, with investors devoting more attentional resources to buy decisions than sell decisions.

When attentional resources are more likely to be equally distributed between prospective purchases and sales, specifically around company earnings announcement days, stocks sold outperform counterfactual strategies similar to buys.

We document managers’ use of a heuristic that overweights a salient attribute of portfolio assets – past returns – when selling, whereas we do not observe similar heuristic use for buys. Assets with extreme returns are more than 50% more likely to be sold than those that just under- or over-performed.

Finally, we document that the use of the heuristic appears to a mistake and is linked empirically with substantial overall underperformance in selling.”

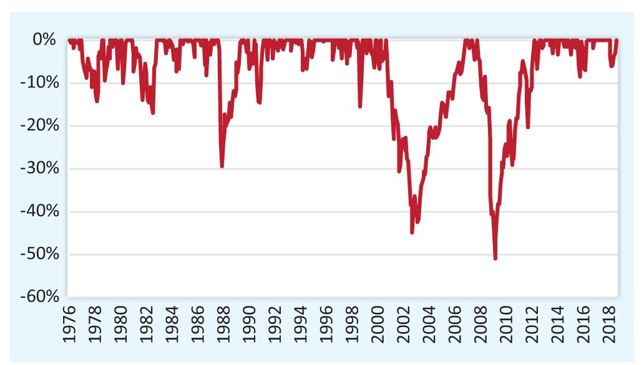
The authors looked at the relative performance of stocks the managers bought and sold and found that buys outperformed a random process but that sells did not. Selling a stock at random would have allowed the manager to obtain better performance.

buy and sell weighted trades

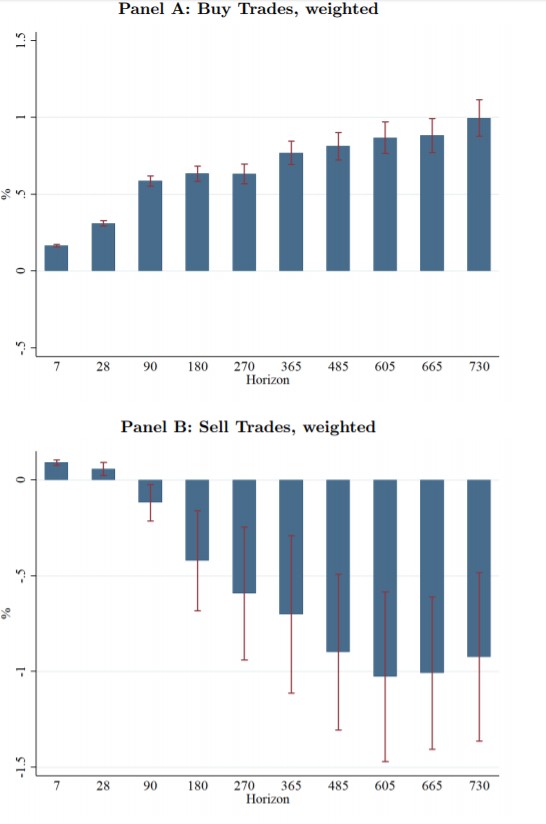
Source: Selling Fast and Buying Slow: Heuristics and Trading Performance of Institutional Investors

Selling Might Be Based On Performance

The paper found that:

“Portfolio Managers in our sample have substantially greater propensities to sell positions with extreme returns: both the worst and best performing assets in the portfolio are sold at rates more than 50% percent higher than assets that just under or over performed.

Importantly, no such pattern is found on the buying side – unlike with selling, buying behavior correlates little with past returns and other observables.”

In simpler terms, “We conjecture that PMs in our sample focus primarily on finding the next great idea to add to their portfolio and view selling largely as a way to raise cash for purchases,” the authors write.

“In order to quickly choose between alternatives to sell, PMs look for salient reasons to unload one asset over another,” and things that have gone up or down a lot are the ones that jump out at them.

Based on the paper, managers seem to be spending a great deal of time searching for the best stocks to buy. They identify these stocks and then identify cash to buy with by reviewing their portfolio for sells. They tend to sell stocks that went up or down the most.

At Bloomberg, Matt Levine noted,

“For another thing it maps rather well onto the folk wisdom about investing.

Anecdotally, if you hang around the financial markets you will get all sorts of generic process advice about how to decide which stocks to buy, and almost all of it—buy good companies with deep moats, buy good companies well below their intrinsic value, buy companies whose business you understand, buy companies that you’ve heard of, buy companies that your teenage children like, etc.—comes down to some sort of fundamental analysis of the underlying businesses.

But you will also get—less, but some—advice about how to decide which stocks to sell, and it will often be pretty heuristic.

“Cut your losses and let your winners run,” is a thing that people say, which has nothing to do with the underlying businesses. “If you double your money, sell and take profits,” it says here, in Barron’s.

Barron's quote

Source: Barron’s

The basic folksy rule of thumb wisdom for buying is about fundamentals, but for selling it’s usually about price action.

Not always: One classic maxim is that you should dispassionately re-analyze each position each day, and if you wouldn’t buy it now you should sell it. But just typing it like that makes me suspect that it is an ideal that no one really lives up to. It sounds like a lot of work!”

This Applies to Individual Investors

As Levine notes, sell decisions are often based on rules of thumb. The classic maxim he refers to appears to be from peter Lynch. He managed the Fidelity Magellan Fund and grew it into the largest mutual fund in the world by the time he retired.

From 1977 until his retirement in 1990, Lynch delivered average annual gains of 29.2% to investors in his fund. Lynch’s gains were more than double the average annual return for the S&P 500.

Based on this research, it appears that Lynch’s performance could be tied to his sell discipline. This would demonstrate the importance of selling and it would highlight how much work it can be to make the sell decision properly.

But selling is important. Selling locks in the gain, and that can be tempting to do when the returns are large. It also locks in a loss and that can be difficult to do when the loss is large. Therefore, it could be best to determine when you will sell before you even buy.

Knowing what will cause a sell could avoid the problems identified in the research. It could be based on fundamentals or the price action but should be defined. That could be the quickest way to improve your investment returns and put you one step ahead of at least some professional investors.

Stock market

How to Invest the Year After “The Year No One Made Money”

Many investors are pleased that 2018 is over. Some analysts are calling it the year that no one made money. This assessment is in part based on a chart showing the large number of asset classes ended the year lower.

stocks under pressure

Source: The Wall Street Journal

The Wall Street Journal noted “All told, 90% of the 70 asset classes tracked by Deutsche Bank are posting negative total returns in dollar terms for the year through mid-November. The previous high was in 1920, when 84% of 37 asset classes were negative.

Last year (2017), just 1% of asset classes delivered negative returns.”

These assets include 30 different equity market indexes, 30 different fixed income market indexes, 5 commodities, 4 credit, 1 home price and cash. Returns for home prices are not finalized yet and are excluded from the chart although they are likely to be up.

Home prices are shown in the chart below. This is a broad index of prices, the S&P/Case-Shiller 20-City Composite Home Price Index. Of course, all real estate is local and many home owners did not enjoy the kind of gains shown in the chart.

home price index

Source: Federal Reserve

These returns affected small and large investors, even some of the best investors who run large hedge funds.

A Mediocre Year for Funds?

Characterizing hedge fund performance is difficult to do since there are so many funds and so many different type of strategies. But according to CNBC, the results for 2018 were good for some. The business news network reported the average fund struggled but some performed well.

“Hedge fund returns for 2018 are trickling into investors’ inboxes.

Some investors — including many who invest in quant funds and larger, established names — will be pleasantly surprised by the numbers in what was otherwise a challenging year in a variety of markets.

Other investors, especially in equities-oriented funds, will be disappointed by losses that even surpassed that of the S&P 500, which was down about 6.7 percent last year.

CNBC has collated 2018 performance details from people familiar with the performance. All of the below numbers are attributed to sources unless otherwise specified. Representatives for each firm declined to comment.

For the most part, many of the established names with billions of dollars in assets were the stellar performers of 2018.

Ray Dalio’s Bridgewater, the world’s largest hedge fund, posted gains in its flagship Pure Alpha strategy of 14.6 percent net of fees. Citadel founder Ken Griffin’s Wellington Fund is expected to be up more than 9 percent in the year, while its global equities fund generated returns of nearly 6 percent, estimated returns show.

D.E. Shaw produced similar returns for its Composite Fund, returning 11.2 percent in the year. Renaissance Technologies’ RIDGE Fund gained upward of 10 percent on the year, while its equities fund jumped 8.5 percent.

All of these funds utilize some sort of algorithmic trading, although some employ it more than others.

Other so-called multi-strategy funds also were able to beat the S&P 500 by a slightly lower margin.

Millennium Management, founded by Izzy Englander, gained almost 5 percent for the year. Och-Ziff Capital Management, the publicly traded hedge fund managed by Daniel Och, lost about 1.3 percent in the year, its regulatory filings showed.”

While those were the stars, not all funds delivered including some of the biggest names in the industry:

“Several multibillion dollar hedge funds opened their coffers to new investors this year with much excitement. Their returns, though, were a little more muted.

For example, Steven Cohen reopened his Point72 Asset Management to outside investors for the first time after his former firm was banned from doing so. Cohen picked up about $5 billion in new money this year.

But Point72 returned about half of a percentage point for investors, preserving capital and outperforming the S&P 500, but not generating outsized returns.”

Trading the Current Market

According to MarketWatch, one well known fund manager has some ideas investors should consider when making their plans for this year:

“DoubleLine Capital founder Jeff Gundlach has warned that the market downturn could be a prolonged one. He’s back with more advice for investors, earning a spot in our call of the day.

After a major meltdown in December, junk bonds have been having a revival of sorts lately, but Gundlach told investors Tuesday to use those gains “as a gift and get out of them.”

Instead, he suggests looking for companies with strong balance sheets. “That’s going to be the way to survive the zigzags in 2019,” said Gundlach, in his annual “Just Markets” webcast Tuesday. And while some say investors may be looking for signs of recession that aren’t there, he said junk-bond spreads are among those “flashing yellow” on that front.

Gundlach also tossed some shade at Fed Chairman Jerome Powell’s rally-inspiring comments last Friday, as he said the central bank chief “went from pragmatic Powell to Powell put and the markets have been throwing a party since then.” He added that the way investors have been piling into the market lately looks similar to what was going on in the credit market before the last big financial crisis.

Other snippets of advice included a call to invest in emerging market stocks over the S&P, especially if the dollar weakens; avoid the value trap in Europe; and for the brave, bitcoin could crawl back to $5,000.

Bitcoin daily chart

One more thing, Gundlach thinks U.S. national debt is “horrific,” describing it as akin to every U.S. household maxing out three credit cards with $5,000 limits.”

Given the risks he sees, Bitcoin or other cryptos could be an appealing trade for aggressive investors right now.

It could also be important to remember that cash is an asset and in a bear market, older investors can be fond of saying they are more concerned with the return of their capital rather then the return on their capital.

The return of their capital means that safety is a priority and they want to reduce the risk of a large loss. The return on their capital represents investment returns and many returns will be negative in a bear market.

Now could be an ideal time to consider safety and follow strategies with limited risk including options strategies like spreads.


Article

This Could Be the Biggest News Investors Are Ignoring Today

The story appears to be straightforward.

“SoftBank is planning to invest $2 billion in WeWork, the leading co-working company according to The Wall Street Journal. The money comes from the conglomerate itself, not from its nearly $100 billion Vision Fund.

 It values WeWork at $47 billion and brings SoftBank’s total investment in the company to about $10.5 billion.”

This looks like an investment in a fast growing company by a leading investment fund. SoftBank Group Corp is a Japanese multinational holding conglomerate.

The company owns stakes in Softbank Corp., Softbank Vision Fund, Arm Holdings, Fortress Investment Group, Boston Dynamics, Sprint (85%), Alibaba (29.5%), Yahoo Japan (48%), Brightstar (87%), Uber (15%), Didi Chuxing (20%), Nvidia (5%), Slack Technologies (5%), WeWork (22%), and other companies.

It also runs Vision Fund, the world’s largest technology fund.

Softbank Logo

SoftBank was ranked in the Forbes Global 2000 list as the 39th largest public company in the world,[8] and the 4th largest publicly traded company in Japan after Toyota.

But, There’s More to the Story

Recently, The New York Times reported that “Softbank dropped plans for a $16 billion investment in shared-office space provider WeWork Cos., opting instead for a smaller deal of about $2 billion amid market turbulence and opposition from investment partners, according to people familiar with the matter.

SoftBank is already a major investor in WeWork having committed more than $8 billion, partly from the Japanese company’s giant tech-investment fund.

The earlier plan to acquire a majority stake in WeWork would have been one of the largest ever investments in a private tech startup, calling for SoftBank to spend $10 billion to buy out existing investors and provide an additional $6 billion in new capital over the next three years, these people said.

Executives at both companies had been in advanced discussions, and as of late last month they had planned to announce the landmark deal Tuesday, these people said.

The exact reason for the pared-back investment is unclear, though the deal faced significant hurdles.

The Wall Street Journal reported in December that SoftBank faced opposition from the two main investors in its nearly $100 billion Vision Fund, which it used in 2017 to buy a $4.4 billion stake in WeWork.

Those investors—sovereign wealth funds connected to the governments of Saudi Arabia and Abu Dhabi—expressed concerns about investing so much, particularly at the $36 billion valuation that was being discussed, people familiar with the discussions have said.

Within SoftBank, the strong support for WeWork has been controversial. Several executives questioned the lofty valuation of a company primarily focused on real estate.

WeWork’s chief executive and founder, Adam Neumann, has marketed it like a tech company, though the vast majority of its business is akin to an office leasing company. It rents long-term space, renovates it, then divides the offices and subleases them on a short-term basis to other companies.”

The report noted that SoftBank’s investors also reacted poorly to a potential deal. When the Journal first reported on the talks in October, SoftBank’s shares fell 5.4% the next day.

The shares are down sharply from their late September peak, though that may be partly due to the broader downturn in technology stocks.

The tech rout likely would have made it harder for SoftBank to raise outside money for the deal as it planned.

Softbank daily chart

The Times noted, “The scaled-back investment shows the limits of SoftBank’s financial ambitions and its eccentric leader, Masayoshi Son.

The 61-year-old executive is making massive bets on the future of technology, typically making investments as he pleases and often basing those decisions on instinct than traditional financial analysis.

Mr. Son has been a steadfast supporter of WeWork. The bet, Mr. Son has said, is that WeWork will grab a sizable chunk of global office space in the coming years, as companies gravitate to its hip, flexible workspaces.

He said on an investor call this summer he is considering moving all of SoftBank’s offices to WeWork locations.

With the larger planned deal, Mr. Son had hoped the sovereign wealth funds would let the Vision Fund pay for some of the deal, a person familiar with the matter has said. SoftBank considered other ways to fund the deal, including using its own cash, raising debt or bringing in outside investors, the person said.

That bigger deal called for all existing investors to be bought out at a roughly $22 billion valuation, less than half the $45 billion valuation set by SoftBank in a November investment.

WeWork had been intending to put off an initial public offering indefinitely. The smaller investment will mean WeWork will need to find cash in future years if it wishes to keep expanding at its current pace.

WeWork has been doubling its revenue every year for the past few years. But the costly renovations associated with expansion have led to heavy losses.

The company spent twice as much as it made in the first nine months of 2018, posting revenue of $1.2 billion and a net loss of about $1.2 billion. Revenue doubled over the same period in 2017, while losses nearly quadrupled.

WeWork has said the rising losses reflect its heavy investment in growth, and that its individual locations are profitable once they are leased.”

Bloomberg’s Matt Levine explained the deal in his usual interesting way, comparing it to a similar deal with SoftBank completed with Uber:

“SoftBank bought a bunch of shares directly from Uber at a high valuation, and more-or-less simultaneously bought a bunch of shares from existing Uber investors at a much lower valuation. It was weird!”

Investors tend to be wary of what Levine calls “weird” deals. The stock price of SoftBank shows this skepticism.

Softbank quarterly chart

SoftBank was among the hottest stocks in the internet bubble in 1999. But the company has never recovered to those levels. Now, it is propping up operations in companies that are losing money.

It is possible that Uber and WeWorks will be profitable soon. It is also possible that the companies are simply subsidizing companies with investments made by SoftBank. That second possibility is frightening for investors.

This is a sign that the startup companies that are widely acclaimed could be overvalued, similar to the position SoftBank found itself and many investments in 2000. This news indicates investors should remain cautious.


Stock market strategies

This Long-Term Trend Could Drive This Stock Up

Investors often say they focus on the long term. If they really do, it could be useful to consider some long-term trends that could deliver gains. In this article, we provide an example of that type of process.

Start With the Trend

One trend that could be important to investors is the growth of the world’s middle class.

According to the recently released Brookings Global Economy and Development Report, the world’s middle class will keep growing, by roughly 160 million each year through 2030.

The report notes, “Figure 5 also shows a sharp acceleration of the speed at which the middle class is expanding. It was only around 1985 that the middle class reached 1 billion people, about 150 years after the start of the Industrial Revolution in Europe.

It then took 21 years, until 2006, for the middle class to add a second billion; much of this reflects the extraordinary growth of China. The third billion was added to the global middle class in nine years.

Today we are on pace to add another billion in seven years and a fifth billion in six more years, by 2028. Of course, thereafter, all the large countries will already have substantial middle classes and the rate of increase will slow significantly. “

global middle class estimates

Source: Brookings Global Economy and Development Report

The report continues, “Figure 6 illustrates this point by showing the increases each year in the global middle-class headcount. The numbers start to accelerate after the turn of the century but peak prior to 2030. The figure also shows the impact of selected global economic events.

annual changes in global middle class width=

Source: Brookings Global Economy and Development Report

In 1998, the middle-class numbers fall as a result of the Asian financial crisis. In 2007, they soar as the global economic boom accelerates, but then collapse after the Great Recession of 2008. Looking to the future, the middle class is set to grow by 160 million people per year on average through 2030.

We are witnessing the most rapid expansion of the middle class, at a global level, that the world has ever seen. And, the vast majority— almost 90 percent—of the next billion entrants into the global middle class will be in Asia: 380 million Indians, 350 million Chinese, and 210 million other Asians.”

From Trend to Investment Thesis

Barron’s recently noted this trend and concluded, “These newly richer folks will want to go places, an observation borne out by the huge jump in air passengers—up four times—since 1985, according to the World Bank. This increase has weathered recessions, financial crises, and terrorist attacks.”

One specific stock to consider is Air Lease (NYSE: AL).

AL weekly chart

Air Lease has about $11 billion in debt and that debt is used to fund the company’s business model. AL borrows money to buy planes, which serve as collateral, and then loans those assets to carriers at a higher rate. Return on equity, which has grown sharply, was 20% in the first three quarters of 2018.

The stock is down, at least in part due to the fact that the airline industry and its suppliers have suffered with the rest of the market, as investors grow increasingly worried about a possible global recession this year or next.

Barron’s notes that decline provides an opportunity to long term investors, “For an investor with a two- to three-year time frame, however, this seems a relatively inexpensive price for a well-managed aircraft-leasing company. On the other side of a putative slowdown, the stock could approach its old high of $50.

A recession would be worrisome in the near term, but Air Lease benefits from two strong, long-term macroeconomic trends that show little sign of ending.

These powerful secular trends bode well for Air Lease, one of four major players and one with a young fleet. Air Lease serves 94 airlines in 56 countries.

The long-term outlook remains positive, says Chris Retzler, a portfolio manager at Needham Asset Management, which holds the shares. “Emerging markets will eventually recover and return to growth, and I like [Air Lease] at these prices,” he adds.

As of the third quarter, the Los Angeles-based company owned 268 aircraft, with a weighted-average age of 3.8 years and a remaining lease term of 6.8 years. Air Lease, which reports fourth-quarter results on Feb. 26, ended the third quarter with its aircraft order book 96% placed through 2019 and 82% placed through 2020 with long-term leases.”

Risks to Consider

The company’s appealingly high return on equity is likely to decline in a recession, but the shares also trade at a price/earnings ratio of five times the consensus earnings-per-share estimate of $5.30 this year, compared with an historical median P/E of 14.

Barron’s considered the downside risks, “Let’s posit that a recession chops EPS to about half of that, or $2.65. Cyclical company P/Es contract in good times—like now—but expand in bad, and a recessionary valuation of 10 times gives a price of nearly $27, 15% below the current level. The dividend yield is 1.6%.

In prior years, Air Lease’s stock dropped ahead of recessionary concerns and then recovered within a couple of years. In good times, airlines lease aircraft to get access to more planes, and in bad times they lease aircraft to replace planes they have had to sell to bolster their balance sheets.

A global contraction will hurt, and new airline entrants, particularly across Asia—the fastest-growing market—could go belly up. That would be tough for the leasing industry to swallow in the medium term.

Yet the stock discounts much of that, and the risk-reward looking out a few years seems attractive.”

AL is an excellent example of how an investor could proceed from trend to stock. The trend in this case is the fact that the world’s population is increasing the number of potential air travelers. There are a number of ways to trade that idea.

AL could be appealing because it does not have to worry about fare wars or other operational questions airlines must consider. AL simply provides airplanes to companies that must address those questions. This makes it an interesting long term investment opportunity.

Uncategorized

The Most Common Mistakes Investors Make

Experience, it is often said, is the best teacher. Perhaps that’s because it can be such a painful lesson to make mistakes. In some ways, it could be that the experience of others is the best teacher since we can learn from their mistakes and not have to make our own costly errors.

In light of that view, it could be useful to review “Learning From the Mistakes Made by Legendary Investors,” a recent article that appeared in the AAII Journal, a publication of the American association of Individual Investors.

Important Lessons for Investors

As a starting point, we will list the errors and then add some detail to several of them:

  1. Investors tend to expect the future to look like the recent past.


  1. Investors behave as if the price we paid for a security somehow should be factored into how we view the investment going forward.


  1. Investors make the mistake of thinking about the stock instead of the business.


  1. People loathe to admit that they were wrong about anything, and this is particularly true with investing.


  1. People often look to others for approval.


  1. People are overconfident.


  1. Success in one area of life does not guarantee success in the market.


  1. People think that if they build the perfect model or if they have better information, then they will be able to beat the market.


  1. Talking to friends and family about investing is a mistake.


  1. Intelligence is not enough.


The Importance of Independent Thinking

Several of the mistakes deal with the importance of ignoring the crowd. That can difficult. Many of us watch CNBC.

CNBC market data

Source: CNBC.com

This can be a source of ideas. But we should also consider why the guests on CNBC are explaining why they like a stock. In some cases, they are attempting to sell us something by showing that they are smart and confident stock pickers.

In some ways, guests on CNBC are at risk of violating mistakes 5 and 6 above. They may be looking for approval and they be overconfident. We simply don’t know their motivation or their thinking. This means we need to think for ourselves.

Besides, the guest on CNBC will not call or email when they change their mind. And, many of them will change their minds. Even if the guest is right and tells us to buy the best stock in the market, we will still need to do our own research to know when to sell.

The importance of independent thinking cannot be overemphasized. But, some great investors have summarized their thinking in anecdotes that could be helpful for us to remember.

Sir John Templeton said, “The four most dangerous words in investing are, it’s different this time.” In the AAII article, the author notes, “I think the most dangerous words in investing are “I’ll sell when I get back to even.”

Anchoring to your purchase price is dangerous because most stocks are losers. Most stocks won’t be sold at a profit or even at a breakeven price. There is nothing wrong with taking a small loss, but big losses are hard to recover from financially and emotionally.

We can all hope that a stock comes back up in price. When waiting for this to happen, keep in mind this observation from hedge fund manager David Einhorn, “What do you call a stock that’s down 90%? A stock that was down 80% and then got cut in half.””

So, that is a simple lesson. Cut losses quickly and avoid larger losses. This means it will be necessary sometimes to admit that we are wrong.

The importance of selling can not be overemphasized. That is especially true because there will be losses in the stock market. The next chart shows that there were frequent drawdowns in equity even in bull markets.

frequent drawdowns in equity exist even in bull markets

Source: AAII.com

This chart shows the percentage loss from the high in the S&P 500 and there are frequent losses. The index will almost always be between 1% and 10% below its high. In the current century, there have been two declines of more than 40%.

Should You Sell In the Declines?

This chart raises the question of how an investor can cut losses quickly since the market is almost always delivering losses of some size. This is perhaps a question of portfolio management.

An investor should maintain a diversified portfolio meaning they avoid putting all of their eggs in one basket. That would imply at least several stocks. They can buy a stock and use a stop loss on that stock. A trailing stop could be better than a static stop loss.

A trailing stop is defined by Investopedia as “a stop order that can be set at a defined percentage away from a security’s current market price. An investor places a trailing stop for a long position below the security’s current market price; for a short position, they set it above the current price.

A trailing stop is designed to protect gains by enabling a trade to remain open and continue to profit as long as the price is moving in the investor’s favor, but closes the trade if the price changes direction by a specified percentage. A trailing stop can also specify a dollar amount instead of a percentage.”

The next chart offers an example of how the trailing stop could be used.

moving average chart

The red line is a moving average that is based on the highs and lows. Any moving average could be used. Or recent lows could be used. Or a simple stop could be set 20% below the highest price since the trade was entered.

The stop moves with the action but will eventually be triggered. When it is triggered, the position could be closed. At that point, an investor could move into a new trade and hold that one as long as it remains above the stop.

In a bear market, a true bear market like the one in 2008, almost all stocks will be in down trends. In that market, gold or fixed income funds could be held. There is always a bull market in something and by avoiding mistakes, these up trends that eventually reverse could provide wealth to investors.


Uncategorized

These Assets Could Be Big Winners, But They Aren’t Right for Many of Us

Investors are flooded with information at the end of the year. There are many articles that review the year in the markets and offer lists of the best performing asset classes. Generally, stocks end up near the top of that list.

Over the long run, stocks have delivered returns that beat inflation and provided compensation for the risks associated with investing. This, of course, applies to the stocks as an asset class rather than any single stock since a company may or may not be able to deliver above average investment results.

But in 2018, major stock market indexes closed down and that led to other asset classes being at the top of the list. Unfortunately, the best performers may not be available to many individual investors.

Best Returns for 2018

In an end of year retrospective in The Wall Street Journal, art, wine and cars were cited as the year’s best investment opportunities.

year-to-date performance

Source: The Wall Street Journal

The article noted, “Who beat the market this year? Investors who like the finer things in life.

Luxury assets, including wine, art, classic cars and fancy colored diamonds, have outperformed stocks and bonds this year.

“People are looking for a place for their cash, and the security of holding something physical is appealing,” said Anthony Maxwell, director at Liv-ex, the London-based wine exchange. “They are looking outside securities, and gold is not what it used to be.”

Investors who put money into art at the beginning of the year saw an average gain of 10.6% by the end of November, according to Art Market Research’s Art 100 Index, the closest thing the industry has to a benchmark.

In November, David Hockney’s painting of a man in a pink jacket by a swimming pool set a record for a living artist at auction, selling for $90.3 million at Christie’s New York.”

One index of fine art shows this performance has been intact for years.

base 100 at 1 Jan 2000

Source: ArtPrice.com

This index consists of the work of 100 artists. The top 10 are shown in the chart below.

rank-artist-weight

Source: ArtPrice.com

Many of these artists are out of reach of the average investor because of their limited availability and high prices.

Wine and Cars

The Wall Street Journal also noted, “Those investing in wine have seen a 10.2% gain this year, according to the Liv-ex 1000 index, a broad measure that covers wines across regions.

“Wine is something to drink and enjoy, and art is something to appreciate,” said Robin Creswell, managing principal at Payden & Rygel, a Los Angeles-based asset manager. “You might enjoy the updraft of higher prices in beneficial markets but you shouldn’t be surprised if there is a downdraft.”

Liv-ex Fine Wine 1000 Index

Source: The Wall Street Journal

Meanwhile, those who own luxury investments can revel in their relative staying power.

“They will always have some sort of market because somebody loves them,” said Andrew Shirley, a partner at global real-estate consulting firm Knight Frank and editor of the group’s Wealth Report. “With a share, there is no sense in owning it for the sake of owning it.”

The market for high-end diamonds has been steady, gaining 0.4% in value in the first three quarters of 2018, according to the Fancy Color Research Foundation in Tel Aviv.

Eden Rachminov, chairman of the FCRF, a diamond-industry body, says the gemstones can help diversify an investment portfolio and there is almost no volatility in prices.

There are risks involved in holding alternative assets, from regulatory reform to changing tastes, such as a recent shift in demand beyond traditional Bordeaux wines to top-end Burgundy and other varieties.

And the wealth effect that people feel from higher stock markets can reverse itself quickly.

“If people make money on the stock market, they have more money to spend on their hobby,” said Dietrich Hatlapa, director of Historic Automobile Group International.

Luxury-car prices were down slightly this year, according to HAGI’s Top Index, which covers rare collectors’ automobiles—a correction, Mr. Hatlapa says, that was expected given the rate at which investors poured money into the vintage-car market following the 2008 financial crisis.

“They decided to allocate more to classic cars as part of their portfolio because they couldn’t find returns elsewhere, but there are more alternatives as interest rates normalize,” he added.

Cars have been the best-performing luxury investment over the past 10 years, gaining 289%, according to a report published by Knight Frank earlier this year. Coins gained around 182%, wine 147% and jewelry 125% over the same period, while antique furniture and Chinese ceramics lost value.

HAGI Top Index of classic cars

Source: The Wall Street Journal

Emerging markets represent a large part of demand growth for luxury assets, leaving prices vulnerable to moves in currency markets too, analysts say.

Wine analysts point to the boom that followed the United Kingdom’s decision in 2016 to leave the European Union. Political uncertainty over Brexit dragged on sterling, the main currency for trade in wine, creating a buying opportunity for international investors.

A Possible Opening to the Market

At least one company is attempting to open the art market to small investors.

“Since its founding in 2017 Masterworks.io has had one mission—to democratize ownership of multi-million dollar masterpieces. Masterworks has created the first public art investment platform that lets anyone invest in some of the world’s most iconic artworks.”

The company purchases blue-chip paintings for millions of dollars—and gives investors the opportunity to purchase shares in a special purpose entity that owns the specific piece, from investments starting at $500.

Masterworks has been featured by CNN, Forbes and the Wall Street Journal and is offering shares of paintings by such luminaries as Claude Monet and Andy Warhol.

“Outside of technology start-ups, I’ve made higher returns investing in art than anything else,” Scott W. Lynn, founder of Masterworks, says.

Paintings at this level, however, have historically only been available for those ultra-high networth individuals. Masterworks is working to democratize fine arts investing. Investors can now purchase shares and see returns through the sale of the painting or trading.

To accept payments for shares electronically, Masterworks turned to Dwolla, a payments platform.

Dwolla, Inc. is a financial technology company that offers businesses an onramp to the Automated Clearing House Network, an electronic network of financial institutions that moves $43 trillion dollars annually.

Masterworks’ users send funds to an account that Masterworks has set up for each individual piece of art. These transactions happen across the ACH Network using the Dwolla integrated API.

This is certainly a risk but individuals may want to diversify and art is certainly one opportunity for diversification.


Uncategorized

Here’s Why 2019 Could Be a Bad Year for Stocks

In the long run, stock prices are driven by earnings. That’s why investors should be concerned about 2019. According to the research firm FactSet, earnings growth is set to slow sharply. According to a recently published research report:

“…the estimated earnings growth rate for CY 2018 is 20.3%. If 20.3% is the final growth rate for the year, it will mark the highest annual earnings growth for the index since 2010 (39.6%).

…the estimated earnings growth rate for CY 2019 is 7.9%.”

In other words, investors must reevaluate the future prospects of the stock market with earnings slowing. It is important to remember that these expectations are not incorporating a sharp economic contraction which some analysts warn is possible.

Valuing Stocks

One reason stocks with slower growth are worth less is related to the idea of valuation models.

Unfortunately, the math to determine the fair value became more complex. Over time, a discounted cash flow (DCF) model has become the most popular way to value a stock.


Discounted cash flow formula
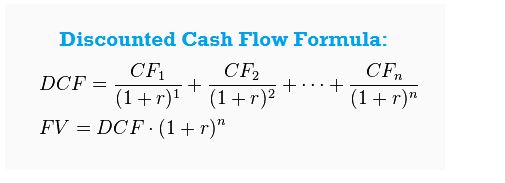
This model recognizes that the value of future earnings is less than the value of current earnings because dollars will probably buy less in the future. This assumption is being reviewed as negative interest rates become more common but for now it is still a widely held belief.

In a DCF model, analysts develop estimates of a company’s future earnings and then make other assumptions to reduce the value of future earnings (by discounting) to today’s dollars.

There are usually a large number of assumptions involved in the process, for example sales and costs of sales need to be estimated along with interest rates, growth rates of the company’s earnings, the number of shares outstanding after accounting for buybacks and option grants and the risk premiums investors will assign different industries among other variables.

With a DCF, the estimated value of a stock can be determined to the penny, but any change in any of the assumptions will lead to a change in the estimated fair value of the stock. Different estimates explain why different analysts assign different price targets to stocks.

Data services usually average all of the available estimates and report a consensus price target. When an investor is considering two different stocks, if one stock is trading above the value defined by the DCF model and another is trading below the model’s price, the one trading below the model’s price should be the better value for investors.

A Simpler Approach

An alternative to the DCF model is the PEG ratio. Specifically, the formula for the PEG ratio is the P/E ratio divided by the EPS growth rate. The PEG ratio assumes a stock is fairly valued when the P/E ratio is equal to the estimates growth rate of earnings per share (EPS). 

When using the PEG ratio, a ratio below 1 indicates a stock is potentially undervalued. Higher PEG ratios indicate stocks are overvalued.

This formula can be rearranged with simple algebra to find the target price (P in the P/E ratio). Fair value for a stock would be the product of the EPS growth rate and EPS.

We can use historic or expected numbers but next year’s estimated earnings and the long-term estimated growth rate are commonly used.

Let’s consider an example using a notional stock that we assume is trading at about $45 and the Wall Street analysts’ consensus target is $57. That value is derived from DCF models.

We can use the PEG ratio and multiply next year’s expected EPS of $3.87 by the expected EPS growth rate of 16.1%. This provides a price target of $62.31. This is fairly close to the consensus estimate and confirms the stock is undervalued.

The value of the PEG ratio is its simplicity and its objectivity. The math is simple – just multiply estimated earnings by the estimated EPS growth rate. This provides an objective value while Wall Street estimates tend to be subjective.

Often analysts will use assumptions designed to ensure a price target is above the current price of a stock. This might be done to help the Wall Street firm win investment banking business from a company even though that is not supposed to happen.

It might also be done because analysts don’t usually recommend selling a stock and setting a price target below the current price is an implied sell recommendation. The PEG ratio removes this type of subjectivity when determining a price target.

Given its simplicity, the PEG ratio could be all you need to find undervalued stocks. However, it does not work in all cases. When a company’s earnings are contracting, the estimated growth rate will be negative and the PEG ratio should not be used.

The PEG ratio is also not normally the best tool to evaluate income stocks. When a stock is valued for income rather than earnings, other valuation techniques are more appropriate.

When looking for buy candidates, the PEG ratio can provide a starting point. But, remember that when a stock is trading above fair value, value investors including Graham and Dodd recommend selling.

While Warren Buffett has popularized the idea that a good stock should never be sold, that rule generally applies only to him. Most of us benefit from selling and moving into stocks which offer better potential rewards.

Looking Ahead

Now, stocks are estimated to be delivering slower growth and the extent of that slowdown can be seen in the next chart.

S&P 500 earnings and revenue growth

Source: FactSet

The sharp decline in growth will mean lower price targets in accordance with the more complex DCF models and the simpler PEG ratio. This is a warning for investors in 2019.

The same will be true of individual stocks. Many companies reported strong earnings growth in 2018 as they recognized benefits of tax reform. The rates will largely be the same for 2019 for companies which means the growth they report will depend on increases in revenue and decreases in expenses.

Of course, share buy backs will also play a role in prices and many companies are still spending billions of dollars buying their own shares. Unfortunately, that might just be one factor driving higher EPS and might not be enough to carry stocks to new highs in 2019.


Uncategorized

Esoteric Markets Could Sink Global Markets in 2019

The prose is rather dry, as you would expect a detailed report written by economists to be. The headline actually tells us little about the startling conclusion that is included. But the article called “Two defaults at CCPs, 10 years apart” tells us we could see a market crash in the near future.

CCPs are central counterparties. They are the global regulators answer to the financial crisis of 2008. The two defaults include one from that crisis and another default that occurred in 2018. The story was in the latest issue of the BIS Quarterly review.

The BIS is the Bank of International Settlements, which is often called the “central bank for central banks” because it provides banking services to institutions such as the European Central Bank and Federal Reserve.

These services include conducting gold and currency transactions, as well as making short-term collateralized loans.

The BIS also encourages cooperation among central banks. The Basel Committee for Banking Supervision (BCBS), while technically separate from the BIS, is a closely associated international forum for financial regulation that is housed in the BIS’ offices in Basel, Switzerland.

The BCBS is responsible for the Basel Accords, which recommend capital requirements and other banking regulations that are widely implemented by national governments. The BIS also conducts research into economic issues and publishes reports.

All of these organizations are working to prevent the next financial crisis.

An Obscure Market Tests the System

The paper cited an example of a failure in 2008, “Lehman Brothers was a brokerage firm that collapsed under the weight of its derivatives portfolio. According to the article, “Central counterparties have been described as “unlikely heroes” for their handling of the Lehman Brothers’ default.

CCPs proved resilient during the crisis, continuing to clear contracts even when bilateral markets dried up. Lehman had derivative portfolios at a number of CCPs across the world and, with one exception, these were auctioned, liquidated or transferred within weeks of the default without exhausting the collateral Lehman had provided.

One example is the unwinding of Lehman’s interest rate swaps portfolio cleared in London (66,390 trades, $9 trillion notional), which used up about a third of the margin held, so that neither the CCP nor its members sustained any losses.”

Next, the paper cited a more recent example:

“…on 10 September 2018, Einar Aas, a Norwegian trader, failed to pay a margin call to the commodities arm of Nasdaq Clearing AB in Sweden.

Aas had bet that Nordic and German electricity prices would converge, by trading in futures on the Norwegian commodity derivatives exchange, Nasdaq Oslo ASA, which clears all trades with the Swedish CCP.

Weather forecasts and a change in German carbon emission policies pushed the two prices apart, driving the value of Aas’s position down sharply (Graph A1, left-hand panel).

German and Nordic electricity markets

Source: BIS Quarterly Review, December 2018

Correlation strategies of this kind were once described, in the case of Long-Term Capital Management, as “picking up nickels in front of a steamroller.”

When Nasdaq made a margin call that Aas failed to pay in full, he was put into default the next morning.

The System Passes the Test

The CCP sought to manage the default by selling the position. In the following days, an auction was held for Aas’s portfolio with four of Nasdaq’s other members. The winning bid resulted in a loss of €114 million in excess of the collateral Aas had provided.

For commodities, Nasdaq’s “default waterfall” (once Aas’s collateral was exhausted) started with capital of €7 million, after which it tapped a €166 million fund made up of contributions from the nondefaulting members (Nasdaq has three services, each with a separate default fund).

Nasdaq collateral and the default waterfall

Source: BIS Quarterly Review, December 2018

In the event, this sufficed to absorb the loss resulting from Aas’s default. In addition to the funds consumed, another layer of capital was available, as well as a general default fund covering all Nasdaq Clearing’s services (Graph A2).

Calculating margin is an exercise based on the past. “Nasdaq has publicly disclosed how it calculated his initial margins. For his Nordic and German futures positions, Nasdaq required Aas to pay 99.2% of the biggest two-day market movements over the previous year, plus 25% of the biggest two-day movement that year.

But the CCP also gave him a correlation offset of 50% on the margin, assuming that German and Nordic electricity prices would continue to move in parallel.

Moreover, Aas was not required to pay any additional margin, even though the position made up a large proportion of the Nordic power market – a market that had been shrinking significantly in volume over the past decade (Graph A1, right-hand panel).

This was despite the fact that liquidation costs are generally high for portfolios which are large relative to the available market. The reasons for this are unclear, but some observers have suggested that margin setting may sometimes reflect competitive pressures.”

Future Concerns

The question this default raised is important to consider:

“How then was Lehman’s default handled without losses in hard times, while Aas’s default forced a CCP to pass losses to members?”

Lehman’s portfolio, while large and complex, was relatively balanced and part of an even larger market. Although it was in supposedly more complex over-the-counter (OTC) derivatives, CCPs had adequate strategies and collateral in place.

This was in stark contrast to Aas’s portfolio, which was undiversified and heavily concentrated in a smaller and less liquid market.

These episodes underscore the importance of maintaining sufficient market liquidity for central clearing to support default management in stressed conditions, and of applying a reliable long-term perspective in order to set accurate margins (Cunliffe (2018)). So, although Lehman’s portfolio was much larger, CCP default management teams could hedge and reduce risks, allowing orderly auctions to take place over a number of weeks following the default.

The conclusion is meant to be reassuring: “These two defaults happened 10 years apart, under very different circumstances. Yet the lesson is timeless: sound risk management and preparation make all the difference between a CCP that absorbs a shock, and one that propagates it.”

The truth is that a large bet in a small market could set off a waterfall financial crisis. Given the state of the markets, it is reasonable to prepare for that.


Uncategorized

This Chart Could Show the Biggest Risk of 2019

As is often the case, investors and analysts are studying the stock market in search of clues about the future of the economy. The economy and the stock market have been linked in the mind of investors for more than 120 years.

Chares Dow developed his Dow Jones stock market indexes to track the economy. Dow noticed the swings in the prices of the stock market moved in line with the economy. He developed his index to track that relationship, hoping to forecast the economy.

The original index, which was devised in the late 19th century, included 12 stocks and the 12 largest companies in the country at the time, representing a sweep of the different kinds of industries which were considered the mature-growth companies.

They have changed over time, allowing the index to keep up with the economy.

Yahoo Finance recently noted, “Changes in the Dow during the last 40 years reflect the migration from a manufacturing economy to a tech and service economy.

Walt Disney replaced USX Corp. (formerly US Steel) in 1991. In 1997, insurance conglomerate Travelers and drugmaker Johnson & Johnson came aboard, while Westinghouse and Bethlehem Steel left.

In 1999, chipmaker Intel and software giant Microsoft joined, replacing Goodyear and Union Carbide. Telecom firm Cisco replaced General Motors in 2009. Nike bounced Alcoa in 2013.”

These changes show the move from industrial giants to consumer services to high technology. In that way, the Dow Jones Industrial Average has kept up with the times.

More Important Than Stocks?

But, as the economy changed, the reliance on railroads and other relationships that were evident to Dow changed. One change has been in how consumers behave with a shift from farm to urban environments being an important historical focus in the United States.

As the population moved to the city home ownership rates changed. The very long term rate of ownership is shown in the chart below.

historical home ownership in the United States

Source: DQYDJ.com

That shift corresponds not just to shifts in where Americans lived but also with shifts in how Americans pay for homes.

MortgageCalculator.org offers insights into the history of how Americans paid for homes:

“Commercial, mutual savings, and property banks expanded into the early 19th century. These lending institutions catered to the unique characteristics of each region they infiltrated. For instance, banks in rural regions issued mortgages to farmers.

The number of banks increased between 1820 and 1860, which also led to an uptick in the volume of loans. During this period, money-lending institutions issued between 55 and 700 million dollars in mortgage loans.

The National Bank Act of 1864 established national bank charters and created greater security for the federal treasury. It also led to the development of a nationalized currency to help finance the Civil War. The nationalized currency replaced state and bank bonds.

The charters allowed for the banking system to expand; however, national banks faced restrictions from directly investing in mortgages and the long-term investment market. In 1893, small state banks started to issue bonds as acknowledgments of debts based on the credit and trust of the debtor alone.

The United States favored these types of mortgages; however, they vastly differed from the loans of today. In fact, the average life of these mortgages only lasted six years and account for less than half of the property’s value.

The United States mortgage market faced disruption during the end of the 19th century. It became a disorganized network of uneven allocated mortgage loans that impacted western farmers negatively. Western mortgage companies sold their loans to Eastern investors.

However, the unsuspecting drought that caused farm foreclosures hurt Eastern investors and caused them to doubt the mortgage investment market. Investors regained their confidence when the West began its recovery and interest rates began to level.

Mortgages featured variable interest rates, short maturities, and high down payments by the early 1890s. Before the Great Depression, homeowners renegotiated their mortgages every year.

The modern mortgage market began to take shape after the federal government intervened during the Great Depression. This intervention resulted in the formation of the Federal Housing Administration, the Federal National Mortgage Association, and the Home Owner’s Loan Corporation.

The Great Depression caused property values to plummet, which destabilized the mortgage market. Homeowners defaulted on their loans when holders refused to refinance their mortgage. Roughly 1/10th of all homes faced foreclosure.

Lending institutions survived by providing government-sponsored bonds to reinstate mortgages in default. It enabled the extension of terms and fixed rates to create self-amortizing loans. Other efforts were made to increase investing confidence in order to stabilize mortgages in poorer areas.

The Second World War introduced provisions written in the G.I. bill for veterans, including the formation of the VA mortgage insurance program. It provided excellent rates and became part of the compensation package of service members.

Lending institutions intended for this to stimulating the housing market. The loan to value ratio increased 95 percent. In addition, the maximum mortgage term extended to thirty years. In 2003, government mortgage institutions accounted for nearly 43 percent of the total mortgage market.”

These factors boosted home ownership, but that trend was reversed after the Great Recession which saw an increase in foreclosures and a decrease in property prices.

home ownership rate chart

Source: Federal Reserve

Ownership Rates Provide a New Insight On the Economy

With so many home owners, and so many more prospective home owners, home prices now offer important insights into the state of the economy. With prices at new all time highs, there is a message for the economy.

U.S. national home price index

Source: Federal Reserve

The pace of change in the price index has slowed and that could lead to worried home owners. Many of these home owners are also stock market investors and their worries run beyond real estate into the stock market.

Declining home prices, or even prices that aren’t rising as much as expected, could dampen the confidence of investors and that could result in panic when stock market prices decline. That could also lead to selling to preserve wealth as concerns over home values raise worries about retirement wealth.

In short, while railroads once led the economy, it could be that home prices now do so. That could spell trouble in 2019 as the prices of homes level off and potentially decline.


Uncategorized

Computers Might Be Making This Decline Worse, or Better

There has been a relentless shift on Wall Street ever since the first traders gathered under the buttonwood tree that grew on the spot of what is now the New York stock Exchange. That shift has been to adopt new technologies and strategies as soon as practical.

The rush to change is driven by the purpose of the gathering under the buttonwood tree. Traders were looking for a way to profit from fluctuations in business and that has been the objective of traders ever since.

But, as so many things in life have changed, the shift is towards speed and with computers, the fastest traders can make a profit. However, this shift has led to concerns that computers are driving the action on Wall Street.

In a recent article called Behind the Market Swoon: The Herdlike Behavior of Computerized Trading, The Wall Street Journal reported that,

“Behind the broad, swift market slide of 2018 is an underlying new reality: Roughly 85% of all trading is on autopilot—controlled by machines, models, or passive investing formulas, creating an unprecedented trading herd that moves in unison and is blazingly fast.

To many investors, the sharp declines are symptoms of the modern market’s sensitivities. Just as cheery sentiment about the future of big technology companies drove gains through the first three-quarters of the year, so too have shifting winds brought the market low in the fourth quarter.

rise of the machines

Source: The Wall Street Journal

Today, quantitative hedge funds, or those that rely on computer models rather than research and intuition, account for 28.7% of trading in the stock market, according to data from Tabb Group–a share that’s more than doubled since 2013. They now trade more than retail investors, and everyone else.

Add to that passive funds, index investors, high-frequency traders, market makers, and others who aren’t buying because they have a fundamental view of a company’s prospects, and you get to around 85% of trading volume, according to Marko Kolanovic of JP Morgan .

“Electronic traders are wreaking havoc in the markets,” says Leon Cooperman, the billionaire stock picker who founded hedge fund Omega Advisors.”

It’s Been a Trend for Some Time

This is largely due to the fact, as The Wall Street Journal has previously reported, “up and down Wall Street, algorithmic-driven trading and the quants who use sophisticated statistical models to find attractive trades are taking over the investment world.

On many trading floors, quants are gaining respect, clout and money as investment firms scramble to hire mathematicians and scientists. Traditional trading strategies, such as sifting through balance sheets and talking to companies’ customers, are falling down the pecking order.

 “A decade ago, the brightest graduates all wanted to be traders at Wall Street investment banks, but now they’re climbing over each other to get into quant funds,” says Anthony Lawler, who helps run quantitative investing at GAM Holding AG .

The Swiss money manager last year bought British quant firm Cantab Capital Partners for at least $217 million to help it expand into computer-powered funds.

Guggenheim Partners LLC built what it calls a “supercomputing cluster” for $1 million at the Lawrence Berkeley National Laboratory in California to help crunch numbers for Guggenheim’s quant investment funds, says Marcos Lopez de Prado, a Guggenheim senior managing director.

Electricity for the computers costs another $1 million a year.

Algorithmic trading has been around for a long time but was tiny.

An article in The Wall Street Journal in 1974 featured quant pioneer Ed Thorp. In 1988, the Journal profiled a little-known Chicago options-trading firm that had a secret computer system. Journal reporter Scott Patterson wrote a best-selling book in 2010 about the rise of quants.

Prognosticators imagined a time when data-driven traders who live by algorithms rather than instincts would become the kings of Wall Street.”

And they have, over time, been moving in that direction. Last year, quant hedge funds became the most active group on Wall Street.

share of stock trading by type of investor

Source: The Wall Street Journal

Now, “The speed and magnitude of the move probably are being exacerbated by the machines and model-driven trading,” says Neal Berger, who runs Eagle’s View Asset Management, which invests in hedge funds and other vehicles. “Human beings tend not to react this fast and violently.”

But, There are Still Trends

While computers and trading strategies make it possible for market moves to unfold in seconds, the moves are still driven by fundamental factors. Among those factors are:

  • A slowdown in growth in the economies of Japan, China and Europe, and suggestions the U.S. might be moderating a little bit too.
  • The end of an era of low interest rates and easy money. In late September, the Fed pushed interest rates above the rate of inflation for the first time in a decade. This month, the ECB confirmed it would end its $3 trillion bond-buying program.
  • A decline in the growth of corporate profits. In each of the first three quarters of the year, profits of S&P 500 companies rose about 25% from a year earlier, helped by the corporate-tax cut. According to FactSet projections, earnings growth for the S&P 500 in the fourth quarter will be less than half what it was earlier in the year. It will fall into single digits in 2019.
  • Erratic politics in large parts of the world. The U.S. and China are embroiled in a trade dispute. President Trump is openly denigrating the Federal Reserve on Twitter. Britain is fumbling through Brexit and Italy through an economic drought with consequences for its giant bond market.

So, there are reasons for the selling that has pushed major market averages significantly lower.

S&P 500 weekly stock chart

Computers are making the move quicker, according to some experts. However, since the computers are really executing programs written by humans, they are not the driving force behind the direction of the trend. They are merely accelerating the trend.

This is the good news. If computers accelerate the trend, that means the down trend and the bear market which seems to have hit stocks, could be over quicker than usual. Then, when news becomes bullish, prices could rebound quicker than usual.