Economy

What Investors Should Know About Brexit

It’s earnings season in the United States and that will drive many headlines in the coming weeks. In addition to that, traders are likely to be following the volatility of the market as they consider the question of whether or not the down turn that began in October is over.

Some traders will look overseas and develop concerns related to the slowing pace of economic growth or of the expected slowdown in Germany. Investors looking at Europe will find problems to worry about in France, Greece and Italy.

But the story of Brexit should also be of concern to traders. This is a story with a deadline and that means a market move is likely soon.

Brexit

Source: Wikipedia

An Overview Of Brexit

CNN helpfully explains:

“What is Brexit?

Britain + exit = Brexit.

It’s the idea (once unthinkable) that the Brits will leave the European Union. But in a stunning result the United Kingdom voted to do just that in a bitterly fought referendum in June 2016.

Since then it’s been talks, disputes, finger-pointing and threats — just like your typical divorce. But the UK and the EU finally might have reached an agreement in which they can finalize their split.

How does it impact the rest of the world?

If you’re a European nation: You have the most to lose — on so many fronts. Just under half of the UK’s exports go to the EU. Just over half of its imports come from the other 27 nations in the bloc.

All of that is now up for a (painful) renegotiation. Then, think about diplomacy. Whenever Europe’s done something useful on that front, the UK — a serious military power — has often been in the driver’s seat.

So, the EU is losing a heavyweight.

If you’re the US: The world’s already dangerous and volatile enough. Some in the United States may worry that the unraveling of the union — a vital ally — will unleash more instability. The UK’s also America’s seventh-biggest trading partner.

It’s been two years since the Brits voted ‘yes’ on Brexit. What’s the holdup?

Turns out untangling a 45-year marriage is not as easy as the Brexiters claimed it would be. The fear of creating some serious unintended consequences (economic or otherwise) is high, and many hurdles have yet to be overcome.

The delays, the dangers and the constant bickering are now — just four months before Britain is due to leave — prompting some who voted for Brexit to change their minds, opinion polls suggest.

What’s happening now? Why’s Brexit back in the news?

They’ve been trying to hammer out a divorce deal, since the UK soon will be outside of the EU trading block. The thought of the UK tumbling out of the EU without a future trade deal scares the living daylights out of business people in Britain and all across Europe.

The negotiations have been tough sledding. So now, after more than two years of wrangling, they’ve come up with this: a draft agreement (in an easy-to-read 585 pages) that lays out how the UK will leave the EU on Friday, March 29, 2019.

But the UK will stay inside the EU’s single market and still be subject to EU laws and regulations until the end of 2020. That will give everyone enough time to … hammer out a future trade deal. So yes, probably two more years of the same.”

Timetable for the United Kingdom's exit from the EU

Source: By Ziko van Dijk – Own work, CC BY-SA 4.0

The Impact On Investors

Marketwatch is following this story closely because the news is affecting investors. In particular, their Brexit Brief tracks the breaking situation as it unfolds. Recently, they noted:

“The U.K. government wants to postpone its March 29 exit from the European Union, but Prime Minister Theresa May cannot say so openly, according to one of the senior parliamentarians.

Yvette Cooper, the chair of parliament’s Home Affairs committee, is leading a new effort within the U.K. legislature to get a postponement. She told the BBC this morning she believes May and other government ministers privately support the idea.

The UK’s Brexit policy is essentially deadlocked following the prime minister’s crushing defeat on her Brexit plans on January 15. Cooper, a politician from the UK’s opposition Labour Party, will put her proposal to parliament today, after a scheduled address from May on what her next steps will be.

Another proposal, from pro-European rebel Conservative Dominic Grieve, would give parliament the power to hold a series of “indicative votes” to determine what form of Brexit could command majority support.”

The stock market has reflected the uncertain situation. For investors in the U. S. an exchange traded fund, or ETF, could offer access to this story. The chart of iShares MSCI United Kingdom ETF (NYSE: EWU) is shown below.

EWU weekly chart

An advantage of trading the ETF is that it provides diversification for investors who may not be familiar with the best companies to trade in the United Kingdom. The ETF is also priced in dollars which eliminates direct costs of currency exchanges since they are included in the fund’s expenses.

EWU initially moved up on the news of Brexit after bottoming shortly before the vote. However, at the beginning of 2018 it became apparent to some investors that the process was not going as smoothly as many had hoped. The deadline was approaching, and no plan was in place.

Traders could buy EWU if they believe the news associated with the rapidly approaching deadline will be bullish. Less optimistic traders could consider using put options on EWU to take a position to benefit from a down move in EWU.

As the deadline nears, volatility could increase and that means options premiums could potentially increase. Aggressive traders could consider selling options to benefit from that possibility and when selling options, spread strategies could always be used to limit risks.

Brexit creates a great deal of uncertainty and that is also creating potential trading opportunities. Now could be an ideal time to enter trades based on the expectations of the trader and options strategies could be especially appealing given their ability to limit risks.


Economy

Forecasts Continue to Deteriorate

As some investors anticipate the end of the stock market decline, others remain worried and some of their concerns are grounded in fundamentals. Experts are lowering their outlook for earnings and economic growth.

These stories seem to be under-followed by media analysts but they could be important. After all, the stock market tends to reflect the outlook for growth in earnings and those earnings depend in part on the economy.

A slowdown in the economy could explain the troubling decline seen in the earnings outlook.

FactSet Reports A Worrying Decline In Earnings

Recently, the research firm FactSet reported:

“Largest Cuts to S&P 500 EPS Estimates in 4 Years for 1st Half of 2019

Over the past three months (October 15 through January 15), analysts lowered earnings estimates for companies in the S&P 500 for the first half of 2019.

The Q1 (first quarter) bottom up EPS (earnings per share) estimate (which is an aggregation of the median EPS estimates of all the companies in the index for Q1) dropped by 5.0% (to $39.37 from $41.43) during this period.

The Q2 (second quarter) bottom up EPS estimate (which is an aggregation of the median EPS estimates of all the companies in the index for Q2) decreased by 4.0% (to $42.36 from $44.13) during this period.

Combined (adding the Q1 2018 and Q2 2018 bottom up EPS estimates), the bottom up EPS estimate for the first half of 2019 (1H 2019) decreased by 4.5% (to $81.73 from $85.56) over the past three months.

How significant is a 4.5% decline in the bottom up EPS estimate for the first half of a year during this period? How does this decrease compare to previous years?

Over the past fifteen years (CY 2004 to CY 2018), the average decline in the 1H bottom up EPS estimate from October 15 through January 15 has been 2.4%. Thus, the decline in the 1H 2019 bottom up EPS estimate was larger than the average over this time frame.

In fact, the 4.5% decline marked the largest decrease since 1H 2015 (-6.6%) and the fourth largest decrease since 1H 2004 over this period (October 15 to January 15).

As the 1H 2019 bottom up EPS estimate for the index declined during the past three months, the value of the S&P 500 also decreased during this same period. From October 15 through January 15, the value of the index decreased by 5.1% (to 2610.30 from 2750.79).”

change in 1st half of year EPS

Source: FactSet

Looking deeper, the lowered expectations were broad based. Ten of the eleven sectors recorded a decrease in price during this period, led by the Energy sector (-14.4%).

change in sector level EPS

Source: FactSet

Global Economy Is Also Slowing

Reports now indicate that as part of its latest quarterly economic outlook report the International Monetary Fund (IMF) just slashed its forecast for 2019 global GDP to just 3.5% from 3.7% as of October.

This is its lowest forecast in three years. In the report, the IMF warned that trade tensions pose further downside risks to global growth and other factors also weigh on growth.

The report notes that “In its second growth downgrade in three months, the IMF blamed softening demand across Europe and recent stock market volatility.

While its US GDP forecast remained somewhat surprisingly unchanged, still seeing a solid 2.5% in 2019 GDP growth, the IMF took a machete to its German GDP forecast, which the IMF now sees growth only 1.3% this year, down 30%, or 0.6% from its forecast last October.

The Monetary Fund blamed soft consumer demand and weak factory production after the introduction of stricter emission standards for cars was behind the shift.

To be sure, recent German economic data has been disastrous, and confirmed the sharp slowdown in the economy, and it will be up to Q1 data to confirm or deny whether a German recession has arrived.”

German GDP

Source: ZeroHedge

China Adds To Woes

The IMF still expects GDP to grow 6.2% in 2019 after 6.6% in 2018 – the lowest since 1990 – and to continue slowing due to the trade war and the government’s failing attempts to reduce systemic leverage.

CNBC reported on China’s recent report.

“China announced that its official economic growth came in at 6.6 percent in 2018 — the slowest pace since 1990.

That announcement was highly anticipated by many around the world amid Beijing’s ongoing trade dispute with the U.S., its largest trading partner.

Economists polled by Reuters had predicted full-year GDP to come in at that pace, which was down from a revised 6.8 percent in 2017.

Fourth quarter GDP growth was 6.4 percent, matching expectations. That was a decline from the 6.5 percent year-over-year growth in the third quarter of 2018.

There were a few bright spots in [the] official Chinese economic data.

Industrial output grew 5.7 percent in December from a year earlier — beating economists’ expectations of 5.3 percent growth — outpacing November’s 5.4 percent growth.

Retail sales data rose 8.2 percent in December on-year, in line with a forecast and up from November’s 8.1 percent gain.

“What we’re seeing in the fourth quarter is that, while the economy is decelerating, we actually still have some support from most of the quarters from the export front-loading,” said Helen Zhu, head of China equities at BlackRock, referring to exporters rushing to ship their goods out of China before new U.S. tariffs hit.

Zhu told CNBC that even though she expected some support from Chinese consumption and tax cuts, growth in 2019 will decelerate this year compared with 2018.

Although Beijing’s official GDP figures are tracked as an indicator of the health of the world’s second-largest economy, many outside experts have long expressed skepticism about the veracity of China’s reports.

“The official GDP figures have been too stable in recent years to be a good guide to China’s economic performance,” said Julian Evans-Pritchard, senior China economist at Capital Economics, a research house.

“But for what it’s worth, the headline breakdown suggests that service sector activity strengthened slightly last quarter,” he added.

Chinese statistics bureau chief Ning Jizhe told reporters on Monday that his country’s trade dispute with the U.S. has affected the domestic economy, but the impact was manageable, Reuters reported.

He said China’s economy has shown a slowing but stabilizing trend in the last two months, and that it was still driven overall by domestic demand.”

Combined, these stories tell investors that they should consider remaining cautious and viewing recent gains as a possible bear market rally rather than the end of the bear. If this was the end of the bear, there will be low risk entry opportunities on pull backs.


Stock market strategies

Investment Picks of the Bond King

Large professional investors are different than individual investors. The professionals seem to generally have access to more information than individuals simply because they have more resources to dedicate to research.

If an investor is managing billions of dollars, fees will be substantial and some of those fees are expected to be allocated to research in order to maintain a performance level that can be expected to help the investor maintain the funds under management.

For this reason, it could be helpful to consider what the best ideas of the biggest investors are. Among the largest investors is Jeffrey Gundlach, the founder of DoubleLine Capital LP, an investment firm. He was formerly the head of the $12 billion TCW Total Return Bond Fund.

At TCW, he finished in the top 2% of all funds invested in intermediate-term bonds for the 10 years that ended prior to his departure when he founded Double Line.

In 2009, Gundlach founded Doubleline, along with Philip Barach and 14 other members of Gundlach’s senior staff from TCW. Barach was Gundlach’s co-manager of the TCW fund. In a February 2011 cover story, Barron’s called him the “King of Bonds”.

Since then, he has made some timely calls and some calls that did not meet expectations.

According to reports, “On March 9, 2011, Gundlach was quoted on CNBC that “Munis Are The New Subprime.” “You’ve got a history of low defaults, which is comforting. But that kind of sounds like what subprime sounded like back in 2006,” Gundlach said.

Gundlach pointed out that even if defaults do not ultimately climb as high as critics like Meredith Whitney had warned, muni bonds will likely trade much lower.

“Between here and the end game, lies the valley. And the valley is full of fear. I think the muni market is going to go down by at least, on the long end, something like 15 and 20 percent,” he said.

The next day, Gundlach reportedly liquidated 55 percent of his personal holdings in municipal bonds. However, the decline he predicted did not occur and on the same day as his liquidation, the Bond Buyer Index closed at 106, with this index closing at 119 on December 30, 2011, up +12.9%.

At the time, Gundlach also stated: “Nobody owns California general obligation bonds because they think it’s an improving credit story,” he said, drawing chuckles from the audience.

However, since March 2011, the ratings of California General Obligation bonds improved from A- to AA- by Standard and Poors and from A1 to Aa3 by Moody’s. Despite that miss, in 2012, he was included in the 50 Most Influential list of Bloomberg Markets Magazine.

He maintains a position as one of the most influential investors.

Looking Ahead

Investors can choose to either follow a large investor or use the large investor as a contrary indicator.

Contrarian investing is defined by Investopedia as “an investment style in which investors purposefully go against prevailing market trends by selling when others are buying, and buying when most investors are selling.

Contrarian investors believe that people who say the market is going up do so only when they are fully invested and have no further purchasing power. At this point, the market is at a peak. So, when people predict a downturn, they have already sold out, and the market can only go up at this point.”

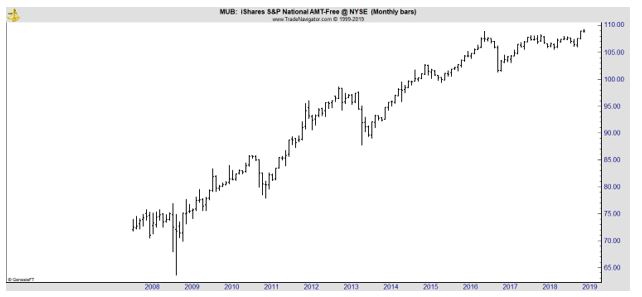
Taking a contrary position to Gundlach’s muni call could have been profitable as the chart of iShares National Muni Bond ETF (NYSE: MUB) shows.

MUB monthly chart

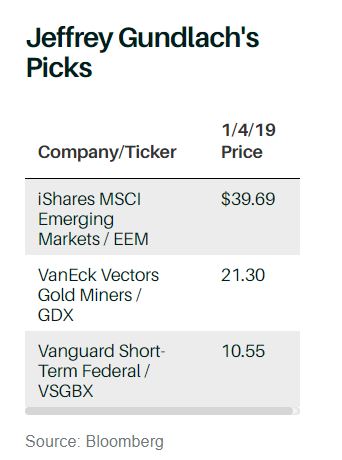
Of course, Gundlach has an extraordinary long term track record and it could be useful to consider his best ideas for the coming year that were reported in Barron’s. Those ideas are shown in the next chart.

Jeffrey Gundlach's picks

Source: Barron’s

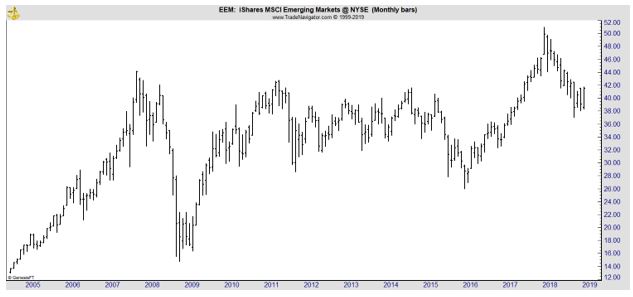
Explaining his pick of EEM, Gundlach told Barron’s, “Here is an interesting thing [holds up a chart of the S&P 500 and the MSCI Emerging Markets indexes]: I “normalized” charts of the S&P 500 and the MSCI Emerging Markets indexes to Jan. 26, 2018, the peak for global markets and the NYSE Composite Index.

You will notice that, for a long time after Jan. 26, the S&P 500 outperformed the global stock market, excluding the U.S. In the fourth-quarter rout, however, emerging markets started to outperform. Emerging markets aren’t a value trap anymore. Even with the headwind of a strong dollar, they are outperforming.”

EEM is shown next.

EEM monthly chart

His idea related to gold is based on what he sees as macroeconomic trends, noting:

“What else does well when the dollar weakens? Well, you might want to buy gold. I turned bullish on gold in the middle of last year at $1,196 an ounce. [Gold was trading at $1,286 on Jan. 4.]

Gold and commodities broadly should benefit this year, although I worry about the economic scenario for industrial commodities. To be aggressive, you could buy the VanEck Vectors Gold Miners ETF. It is a leveraged play on the price of gold. That is what I recommend.”

Of course, there are other trades for gold however Gundlach seems to recommend diversified investments which could be an excellent approach for individual investors. This theme is evident in his third recommendation, as well.

Gundlach concluded, “in the bond market, I don’t like to tout DoubleLine’s products, so I’ll go with a low-cost, one- to four-year average maturity U.S. Treasury fund. How that’s for unsexy? It’s Vanguard Short-Term Federal fund.

I don’t invest in anything with a maturity of five years or longer. I’m concerned about U.S. budget problems leading to a potentially much steeper yield curve, so I want to stay relatively short term. The Vanguard fund is a laddered fund.

As bonds mature, the money is reinvested. You will compound your gains if interest rates go higher.”

Of course, investors could use this as a starting point for their own research and could build their own bond ladder, identify potentially market beating gold mining stocks and research markets and companies in the emerging market space.

As an alternative, a small allocation to these investments or an investment in a DoubleLine product would also benefit from Gundlach’s expertise.


Stock market

Losses Hurt More Than Many Investors Realize

Many investors readily adopt an attitude that they can’t beat the market. This makes sense for many since they have tried and been unable to succeed in many cases. This attitude results in a simple strategy which generally includes buying and holding index funds.

Index funds match the market. Often there are slight differences between the index’s performance and the index fund, and those differences can be explained by fees and decisions the management makes regarding dividends.

Those differences are generally immaterial to investors who take comfort from the fact that that they are not beating the market, but they are at least matching its performance.

A Potentially Hidden Goal

Ideally, if the stock market index moves up by 10%, the index fund will move up by 10%, or 9.9% after fees. This is how many investors envision their holding behaving. Of course, the opposite is true.

If a stock market index declines by 10%, the index fund should be expected to lose 10%, or maybe 10.1% after fees are included. Losses, of course, are a part of investing. But, in bear markets stock markets can and have in the past lost more than 50%. Many investors may be unprepared for that.

But that is the goal of an index fund. If an investor decides their primary objective is to track the indexes, their goal is then to lose 50% of the value of their portfolio if a bear market such as the one that began in 2000 or 2008 occurs.

Now, in reality, the investor’s goal might not actually be to lose 50% of their portfolio. But they accept that as part of their strategy because the conventional wisdom is that you can’t beat the market.

Recent research however shows that it could be possible to outperform in the long run with less risk. In fact, the research looked at a strategy that strives to capture just half the gains on the upside while avoiding half the losses on the down side. The results might be surprising, as the research noted.

Current Conditions Impact Future Returns

The buy and hold argument is based on history that demonstrates stock market indexes deliver positive returns in the long run with the long run generally being defined as twenty years or more. But investors should consider several questions besides long return.

Crestmont Research recently summarized the problem:

“This article addresses two key questions for investors today: why do secular stock market cycles matter and how can you adjust your investment approach to enhance returns?

The primary answer to the first question is that the expected secular environment should drive your investment approach. The investment approach that was successful in the 1980s and 1990s was not successful in the 1970s nor over the past 19 years. “

In other words, the past is no more than a useful guide to investors. But Crestmont raised an interesting point for investors to consider.

“Now, assume for a moment that you must pick one of two investment portfolios. The first is designed to return all of the upside—and all of the downside—of the stock market. The second is built such that it often gets one-half of the upside and one-half of the downside.

Which Would You Pick?

Without thinking, many investors pick the first. But,

“let’s assume that you have a half and half portfolio—50% down-capture and 50% up-capture. As the market falls 40%, your portfolio declines 20%—from $100 to $80. Then as the market recovers 67%, your portfolio rises by just over 33%. Your $80 increases to almost $107.

So while the market portfolio gyrated from $100 to $60 and back to $100, your portfolio progression was $100, $80, and then $107.

Even better, consider the impact across multiple short-term cycles. The typical secular bear market has multiple cyclical phases—and there will be more of these cycles before the current secular bear is over.

The effect of multiple cycles on the “rowing” portfolio is cumulatively compounding gains while the result for the “sailing” portfolio is recurring breakeven. The second cycle (using the same assumptions) drives the “rowing” portfolio from $107 to $85 and then to $114.

The score after the third cycle: Mr. Market = $100 and your portfolio = $121. Three cycles of breakeven for the market still results in breakeven—you can’t make up for it with volume.”

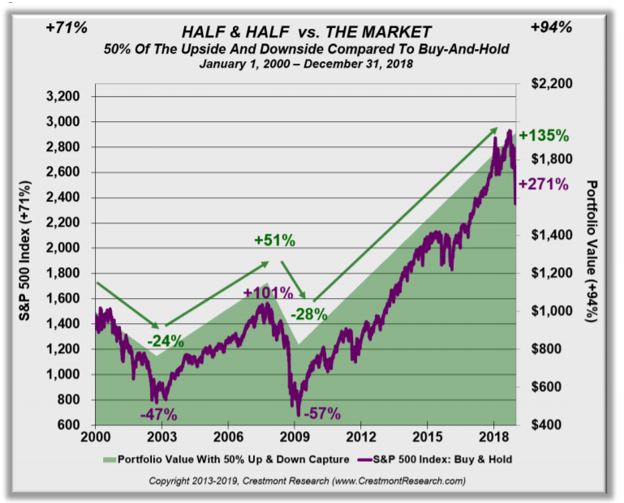
Since 2000, this strategy beat the market, gaining 94% while the S&P 500 gained 71%.

Half & Half vs. The Market chart

Source: Crestmont Research

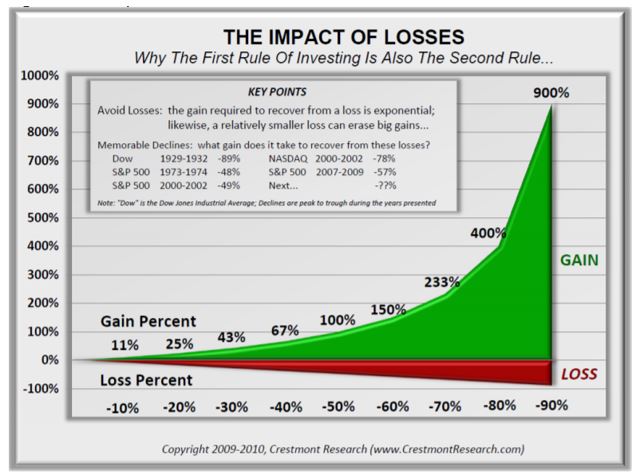
The reason this portfolio outperforms is because of the impact of losses. A loss of 50% requires a gain of 100% to get back to break-even while a loss of 25% requires a gain of just 33% to get back to break-even.

the impact of losses chart

Source: Crestmont Research

The impact of two bear markets which cost market portfolios more than 50% of their capital can not be overestimated. In fact, as the data shows, it would have been better to have just half of a portfolio dedicated to stocks over that time.

This idea, what the author calls a rowing based portfolio can be implemented in a number of ways, He notes,

“…rowing based portfolios often consider and include when attractively valued—a variety of components, including but not limited to:

  • specialized stock market investments (e.g., actively-managed, high dividend, covered calls, long/short equity, actively rebalanced, preferred stocks, etc.),
  • specialized bond investments (e.g., actively managed, convertible bonds, inflation-protected securities, principal-protected notes, etc.),
  • alternative investments (e.g., master limited partnerships, royalty trusts, REITS, commodity funds and advisors, private equity, hedge funds, timber, etc.),
  • annuities,
  • variable life,
  • and others.”

For individual investors, it could be as simple as allocating just half their funds to the stock market and holding more cash than a traditional portfolio allocation would consider prudent. The goal is to capture just half the market move and in the long run, that could be better than fully capturing the gains and losses.

This is important to consider with valuations elevated after a ten-year bull market. Now could be an ideal to consider something different to avoid an inevitable bear market.


Stock market

Ladders Could Be the Best Fixed Income Allocation

Interest rates rise and fall nearly every day. That is true for almost any investment in the financial markets. But after ten years of historically low interest rates, income investors are faced with a dilemma that is easy to understand.

They wonder if they should invest now, potentially locking in rates that are low by historic standards or hope for higher rates which, of course, are always possible within months.

There is a solution to this problem that involves investing now and later. It is a solution that could meet the needs of many investors and it is known as a bond ladder.

A Ladder Reduces Risk

Fixed income investing means buying an investment and collecting income until maturity at which time the amount of investment is returned. This requires making a decision about how long to invest the money for. Longer periods to maturity offer higher income.

But, longer terms also carry the risk that interest rates will rise. If rates rise, the investor loses out on potentially higher income. The difference in rates for different periods of time is significant so the decision can be challenging.

2 year T-Note Index

An investor could earn an annualized rate of about 2.5% using Treasury securities maturing in two years. Or, they could lock up funds for 30 years and earn a little more than 3% a year. While the gap between the two is relatively narrow, it has been much larger in the past.

The probability of rates rising within the next 30 years appears to be high and the investor would forego higher income if they lock in that rate now. That is because the value of the 30 year bond will fall as interest rates rise so it will be impossible to sell and lock in the higher gains.

Many investors treat the decision about the maturity of their investments as an all or none type of questions. They decide how long to invest for and then buy a security that matches that time frame. A better alternative could be to use a ladder.

A bond ladder is a multi-maturity investment strategy that diversifies bond holdings within a portfolio. It reduces the reinvestment risk associated with rolling over maturing bonds into similar fixed-income products all at once.

In simpler terms, according to Investopedia, “a bond ladder is the name given to a portfolio of bonds with different maturities. Suppose you had $50,000 to invest in bonds. By using the bond ladder approach, you could buy five different bonds each with a face value of $10,000 or even 10 different bonds each a with face value of $5,000.

Each bond, however, would have a different maturity. One bond might mature in one year, another in three years and the remaining bonds might mature in five-plus years – each bond would represent a different rung on the ladder.”

The Ladder in Practice

Bond ladders do reduce the opportunity costs associated with higher interest rates and they do solve the problem of an all or none decision. However, there is the question of whether or not the bond ladder hurts the income investor if rates fall.

To answer that question, there is data available. Crestmont Research has looked at that question and a summary of their testing is shown below.

bond ladders

Source: Crestmont Research

In a bear market, bond prices are falling, and interest rates are rising. At these times, the left side of the bottom section of the chart, the bond ladder will deliver acceptable returns, on average. Shorter term bonds carry the least risk.

The favorability of shorter term maturities holds in bull markets as well. These are times when bond prices are rising and interest rates are falling. Notice that there is a greater likelihood of losses when 15 or 20 year bonds are used.

The data suggests that 5 or 7 years could be the sweet spot for a ladder, especially when facing a secular bear market in bonds which is possible in the long run.

To build a five year ladder, an investor could own five bonds, each maturing one year after the next. To build the initial ladder, an investor could buy bonds maturing in 1, 2, 3, 4 and 5 years. As each one matures, a new 5 year bond would be bought.

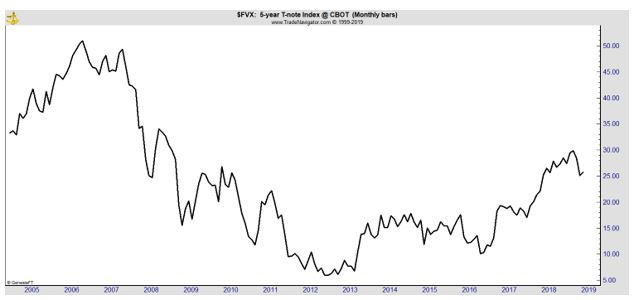
The long term chart of five year Treasury yields does show there is potential up-side possible.

5-year treasury yield

Rates could almost double to reach the level they saw in 2005. Of course, rates could also fall and they were significantly lower just five years ago.

Alternatively, shorter term investments could be used, maturing every six months, for example. This would require purchasing 10 different securities for a five year ladder but a new five year investment would still be bought when each one matures.

There may not be securities available to exactly match the desired maturity dates and that could require holding cash for some period of time to align the ladder with the objectives. This strategy could take months to properly construct.

Now, income could be increased by extending the maturity of the ladder. However, there are more risks, whether rates rise or fall, with longer maturities. There is no guarantee of profits with this strategy but history shows the five year has never delivered a loss.

There is, unfortunately, no right answer as to what a fixed income investor should do. That is the same situation investors in the stock market face. There are countless possible answers, each with unique risks and potential rewards.

Bond ladders can minimize the pain that fixed income investors experience when interest rates rise. The ladder is designed to adapt to changes in rates and could deliver higher incomes than a buy and hold investment in the long run.

If rates fall, an event that seems unlikely but is certainly possible, a ladder will deliver lower income than a buy and hold investment. Each investor should consider the risks and rewards of the strategies and make the choice that matches their personal preferences for risk.


Stock market

This Could Be A Big Year for Initial Public Offerings

This could be a big year for initial public offerings or IPOs. According to Investopedia,

The process of offering shares in a private corporation to the public for the first time is called an initial public offering (IPO).

Growing companies that need capital will frequently use IPOs to raise money, while more established firms may use an IPO to allow the owners to exit some or all of their ownership by selling shares to the public.

In an initial public offering, the issuer, or company raising capital, brings in underwriting firms or investment banks to help determine the best type of security to issue, offering price, amount of shares and time frame for the market offering.

But there are some reasons individual investors should be wary of IPOs.

Potential Big Name Offerings

MarketWatch.com noted, “The 188 IPOs took place in 2018 as of mid-December raised more than $45 billion, over 20% more than companies raised at the same point in 2017, according to data from Renaissance Capital.

And 2018’s deals included billion-dollar tech names such as Dropbox (DBX), Eventbrite (EB) and DocuSign (DOCU) .

But even-larger IPOs are on the horizon for 2019, with giant companies like Uber, Lyft and Palantir preparing to go public provided that the markets hold up.

Last month, Lyft announced it had filed confidentially to go public and Uber reportedly did the same the very next day, with both firms reportedly racing to debut in 2019’s first quarter.”

The site listed the eight most highly anticipated tech IPOs for 2019, listed in order of their latest valuations:

Tech IPOS to watch

Source: MarketWatch.com

  1. Uber

At a recent private valuation of $120 billion, according to a recent report, an Uber IPO at that level would be the biggest public offering ever.

CEO Dara Khosrowshahi has said many times that he intends to take the company public in 2019, provided that market conditions hold up, and the company hired CFO Nelson Chai in August to help get them there. In preparation for the public offering, Uber has been publishing financial statements for several quarters that show increasing revenue but substantial losses for the ride-share giant.

  1. Palantir

One of the most highly-valued U.S. tech “unicorns,” the secretive data mining and analytics firm Palantir isn’t discussed as frequently as ride-hailing giant Uber — but it, too, is valued in the tens of billions of dollars.

According to an October Wall Street Journal report, the firm was in discussions with Credit Suisse and Morgan Stanley for a potential 2019 IPO, which could value the firm as high as $41 billion and happen in the back half of next year.

  1. Lyft

Uber’s smaller nemesis is also racing towards a 2019 IPO, and may be trying to beat its competitor to the punch. Lyft was valued at $15.1 billion in June, when it raised $600 million.

The company signed on JPMorgan to lead the offering. Unlike its larger ride-hailing counterpart, Lyft operates only in the United States, but both firms are striving to re-frame themselves as transportation and mobility companies with assets beyond just ride-hailing, including e-scooter and bike-sharing businesses.

  1. Pinterest

Despite its ubiquity as an image-sharing app, Pinterest mostly flew under the radar as an IPO candidate until this year when it reportedly doubled its ad revenue.

Its ad revenue for this year was projected to hit $1 billion in July, according to CNBC, nearly twice the previous year’s number. Pinterest was privately valued at $12.3 billion during its last round of financing in 2017.

  1. Rackspace

If the name sounds familiar, it’s because 20-year-old Rackspace, which specializes in cloud computing services, was a public company until 2016, when the private equity firm Apollo Global Management took the firm private in a deal worth $4.3 billion.

Now, Apollo may be considering a fresh IPO of Rackspace according to a May Bloomberg report, which quoted a valuation of $10 billion and a potential target date of sometime in 2019.

  1. Slack

The workplace messaging darling may finally be ready for its close-up. Slack’s run as a popular workplace communication tool has meant that it’s fended off acquisition talks over the years from suitors such as Microsoft and Salesforce.

CEO Stewart Butterfield says that he intends to take the company public and appointing Slack’s first-ever CFO in February. The company is said to be planning an early 2019 IPO at a $7 billion valuation.

  1. Robinhood

Robinhood has evolved into a brokerage for the mobile-first generation. Unlike traditional brokerages that earn money on commissions, Robinhood earns revenue from interest and cash on its accounts, as well as from premium subscriptions, and offers crypto trading as well as equities.

Its latest round of financing in May valued the company at $5.6 billion, and CEO Baiju Bhatt confirmed the company’s IPO plans in September.

  1. Cloudflare

CloudFlare, which sells performance and security services for websites, is a well-established name in web hosting and cybersecurity that could go public in 2019. The company is aiming to turn its ubiquity — it serves about 10 million web domains, according to its website — into a successful public offering.

According to Reuters, Cloudflare is seeking an IPO in the first half of next year that could value it at $3.5 billion, a transaction that will be led by Goldman Sachs.

Should You Buy the IPO?

Will these companies be a good deal for individual investors when their offering is completed? Maybe not. It could depend, in part, on the lockup.

An IPO lockup also referred to as a “lock-up period,” is defined as a contractual caveat referring to a period after a company has gone public when major shareholders are prohibited from selling their shares. Lock-up periods usually last between 90 to 180 days.

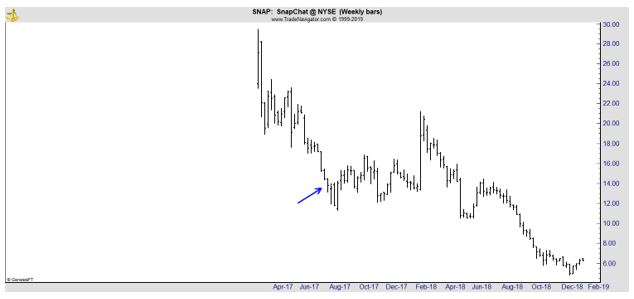
Once the lockup period ends, most trading restrictions are removed. And at times the stock drops sharply. This happened in the case of Snap (NYSE: SNAP).

Selling accelerated into the end of the lockup and was then heavy after the lockup. The blue arrow on the chart below shows the end of the lockup.

SNAP weekly chart

More recently, Tilray (Nasdaq: TLRY) faced pressure ahead of the end of the lockup.

TLRY daily chart

TLRY took active steps to reduce the impact of the news of the lockup ending by announcing, that same day, a deal with Authentic Brands Group to develop and market consumer cannabis brands around the world.

“Through the deal, Tilray is hoping to get its cannabis products into more mainstream retail outlets — both brick-and-mortar and online — than the cannabis dispensaries’ direct-to-patient sales that are Tilray’s primary modes of sales right now. Authentic lists Walmart Inc. and Macy’s Inc., among others, as partners on its website,” according to MarketWatch.

This could indicate TLRY is a buy at this level as management is actively trying to boost the stock price.


Personal finance

Many Investors Seemed to Forget About Bernie Madoff

In the midst of the financial crisis in 2008, a story broke that pushed declining stock prices out of the headlines at times.

Bernard Madoff was a respected founder of an investment firm. Madoff founded a penny stock brokerage in 1960 which eventually grew into Bernard L. Madoff Investment Securities. He served as its chairman until December 2008.

The firm was one of the top market maker businesses on Wall Street, which bypassed “specialist” firms by directly executing orders over the counter from retail brokers.

He was the former non-executive chairman of the NASDAQ stock market with an incredible amount of respect in the business. 

He also managed money for a number of clients who believed they were enjoying steady gains.

On December 10, 2008, Madoff’s sons told authorities that their father had confessed to them that the asset management unit of his firm was a massive Ponzi scheme, and quoted him as saying that it was “one big lie”.

The following day, FBI agents arrested Madoff and charged him with one count of securities fraud. The U.S. Securities and Exchange Commission (SEC) had previously conducted multiple investigations into his business practices but had not uncovered the massive fraud.

On March 12, 2009, Madoff pled guilty to 11 federal felonies and admitted to turning his wealth management business into a massive Ponzi scheme. In June of that year, Madoff was sentenced to 150 years in prison, the maximum allowed.

Madoff said that he began the Ponzi scheme in the early 1990s, but federal investigators believe that the fraud began as early as the mid-1980s and may have begun as far back as the 1970s. The amount missing from client accounts was almost $65 billion, including fabricated gains, from an estimated 4,800 clients.

Lessons Learned?

From all of the publicity generated by the scheme, it seems investors should have learned important lessons. But recent news indicates that Ponzi schemes still exist.

U.S. Securities and Exchange Commission

In December 2018, the SEC announced that they had “charged a former Rockland County, New York-based investment adviser and his daughter with conducting a multi-million dollar Ponzi scheme that defrauded local community members as well as members of their family and close friends.

The SEC alleges that Hector May, an investment adviser representative and the president and chief compliance officer of the now-defunct Executive Compensation Planners Inc. (ECP), and his daughter Vania Bell, who served as ECP’s controller and senior compliance administrator, misappropriated more than $7.9 million in a Ponzi scheme involving bonds.

According to the SEC’s complaint, with Bell’s help, May lied to investors by promising to invest their money in bonds when they actually used the money to pay for personal and business expenses, as well as extravagant items, such as jewelry, furs, vacations, and a limousine driver.

To conceal the fraudulent scheme, they sent bogus account statements to clients referencing the bonds that had never been purchased.”

There are other examples of Ponzi schemes on their web site.

Fortunately, there are steps an investor can take to limit the risk of being victims of one of these schemes.

Understanding the Scheme

A Ponzi scheme is an investment fraud that involves the payment of purported returns to existing investors from funds contributed by new investors. Ponzi scheme organizers often solicit new investors by promising to invest funds in opportunities claimed to generate high returns with little or no risk.

In many Ponzi schemes, the fraudsters focus on attracting new money to make promised payments to earlier-stage investors to create the false appearance that investors are profiting from a legitimate business.

With little or no legitimate earnings, Ponzi schemes require a consistent flow of money from new investors to continue. Ponzi schemes tend to collapse when it becomes difficult to recruit new investors or when a large number of investors ask to cash out.

There are generally red flags associated with the scheme:

  • High investment returns with little or no risk. Every investment carries some degree of risk, and investments yielding higher returns typically involve more risk. Be highly suspicious of any “guaranteed” investment opportunity.
  • Overly consistent returns. Investment values tend to go up and down over time, especially those offering potentially high returns. Be suspect of an investment that continues to generate regular, positive returns regardless of overall market conditions.
  • Unregistered investments. Ponzi schemes typically involve investments that have not been registered with the SEC or with state regulators. Registration is important because it provides investors with access to key information about the company’s management, products, services, and finances.
  • Unlicensed sellers. Federal and state securities laws require investment professionals and their firms to be licensed or registered. Most Ponzi schemes involve unlicensed individuals or unregistered firms.
  • Secretive and/or complex strategies. Avoiding investments you do not understand, or for which you cannot get complete information, is a good rule of thumb.
  • Issues with paperwork. Do not accept excuses regarding why you cannot review information about an investment in writing. Also, account statement errors and inconsistencies may be signs that funds are not being invested as promised.
  • Difficulty receiving payments. Be suspicious if you do not receive a payment or have difficulty cashing out your investment. Keep in mind that Ponzi scheme promoters routinely encourage participants to “roll over” investments and sometimes promise returns offering even higher returns on the amount rolled over.

To limit risks, consider searching for your investment advisor in BrokerCheck, a free tool to research the background and experience of financial brokers, advisers and firms.

Broker Check

Source: BrokerCheck

This is a website sponsored by FINRA, the Financial Industry Regulatory Authority, Inc.

“FINRA is an independent, non-governmental regulator for all securities firms doing business with the public in the United States. We are authorized by Congress to protect America’s investors by making sure the securities industry operates fairly and honestly.”

Watching for red flags and using BrokerCheck could be small steps towards avoiding becoming a victim. Finding that there are complaints against a broker does not mean the broker should be avoided. It does mean you should consider talking to the broker to understand why the complaint was made.

Also, always be sure you understand where your money goes. It could be best to deposit funds into brokerage accounts rather than with individuals.

Working only with registered individuals in good standing with regulators will not avoid all frauds, but it will go a long way to avoiding losses.


Economy

This Scary Chart Could Actually Guide Traders Through This Market

Some charts are interesting but, at first glance, they seem like nothing but an interesting coincidence. Among the more popular charts like this are analogue charts. An analogue is defined as “a person or thing seen as comparable to another.”

Some analysts spend a great deal of time preparing these charts. And, at times they make sense. One popular analogue in this market is comparing the action under President Trump to the market action during the administration of President John F. Kennedy.

A Historian Makes the Connection

Now it is important to separate political opinions from market opinions and it is important to read comments that are political in an objective light. We are not trying to stake out a position on either side of the current political debate but we do find value from a trading perspective in considering this information.

About a year ago, MarketWatch.com noted,

“Last summer, Niall Ferguson, British historian and senior fellow at Stanford University, banged out a laundry list of the president’s shortcomings:

  • He’s a serial adulterer with medical issues that he keeps hidden from the press.
  • He hired a close relative to work in his administration.
  • He’s got a back-channel to the Kremlin.
  • He’s a disrupter who uses modern media to communicate directly to the public.
  • And the prospect of nuclear war under his leadership is more than a little unsettling.

He was talking about JFK, of course. Who else?

So, Ferguson isn’t the only one who has drawn comparisons between Donald Trump and John F. Kennedy. In fact, even Microsoft  founder Bill Gates made the claim (sort of) shortly after the election.

Obviously, finding similarities in the two has also been met with plenty of raised eyebrows, including a pair from MarketWatch’s Howard Gold.

But over the weekend, another theory emerged tying them together — and if it plays out, investors will have a rough road ahead of them.

“This market is starting to look very similar to the JFK post-election rally, top and bear market, which eventually bottomed when Khrushchev backed down during the Cuban Missile Crisis,” the blogger behind The Global Macro Monitor wrote.

Our chart of the day is the illustration he drew to bolster his point:

Kennedy-Trump S&P 500 Analog

Let’s hope, for investors’ sake, the comparisons end here.”

An Update Contains Bad News and Good News

Recently, this analogue chart was updates and MarketWatch.com noted,

One year after we pointed out uncanny similarities between the market with Donald Trump in the White House and the one under John F. Kennedy, the charts are tracking as closely as ever. That could mean good times ahead for bulls.

But not without some more lumps first.

Back in April, the Global Macro Monitor blog, which was the first to draw the comparison, warned in an update that, if the trend in the chart below were to continue, the S&P 500  would soon take a big hit:

Kennedy-Trump S&P500 Analog-trading day 366

It may have taken a bit longer than expected, but the selling sure came, and the charts are now in lockstep. In fact, Wall Street has taken notice.

In a note shared on the Zero Hedge blog over the weekend, Goldman GS, +0.96% strategist David Kostin chimed in about how the current retreat, driven by policy concerns, mirrors the “Kennedy Slide” of 1962, which came against the backdrop of the Cuban Missile Crisis, when Kennedy demanded Soviet-leader Nikita Khrushchev remove nuclear-missile installations in Cuba.

Here’s Goldman’s zoomed-in version of the analog:

policy concerns caused sharp decline in 1962

As you can see, if the charts keep tracking, look for the S&P 500 to drop to a low around 2,300 before building a base and rebounding. Goldman’s base target for 2019 is for the S&P to reach 3,000, which mostly aligns with the comparison.

Global Macro Monitor gave several reasons why the analog works, including geopolitical jitters, extreme valuations, inflation woes, etc. But the blogger pointed to one compelling stat, in particular: The S&P’s big move in a short period of time after each election: JFK — 30.1%, 285 days; Trump — 34.8%, 306 days.”

“Bear markets always follow bull markets and the bigger the prior move in a compressed time frame, the harder the fall,” he said. “Bear markets look for catalysts to sell, but the underlying vulnerability remains — valuation and longer-term overbought conditions.”

The Market Could Follow That Analogue

Looking ahead, the analogue calls for a period of consolidation with potentially slightly lower lows followed by a rally. In other words, this is bad news followed by good news. Considering the current environment, the short term outlook could remain bearish.

There is a possibility economic growth will slow down based on the government shutdown. That should be a small impact but it is just another small factor weighing on the economy.

The Federal Reserve’s policy is also weighing on the economy and the stock market as higher interest rates potentially slow speculation and could reduce the amount of large purchases of capital equipment, homes and other items.

Trade wars are also a concern for traders as are a variety of other factors. However, there is the potential for good news.

Over the course of the coming months, it is possible the White House and Congress will find ways to work together. International negotiations could solve trade concerns or at least reach resolve the issues enough to put them in the background for traders.

Traders should have an idea of the likelihood of good news in coming weeks as earnings reports are announced. This could show how serious trade war concerns and political turmoil is for companies.

In addition to news, from a technical perspective, the stock market and many individual stocks are oversold and likely to bounce for at least the short term. This bounce could shift sentiment from bearish to bullish and the bounce could be the beginning of a new trend.

Overall, there is room for optimism and pessimism. But for the most part, traders should be aware of the potential for a turn around which could push stocks back to old highs before the end of the year. This would be, in general, consistent with the analogue that compares the current market to the stock market in the 1960s.

But, then, bad news could come quick. That bounce that began in 1962 ended in 1966 as a 16 year bear market began. But that is years away and traders should focus on the short run rather than the historical analogues that make for interesting speculation.


Personal finance

Is Vanguard’s Decision to Limit Choices Good For You?

It’s an argument that libertarians are prone to make. As a political philosophy, libertarianism, in the broadest sense of the term, places liberty first. The role of the state is to protect the liberty of its citizens and its citizens must respect the rights of each other.

One example of this philosophy is the libertarian argument that we should legalize recreational drugs in the name of freedom and personal autonomy. Drug prohibition, they argue, infringes on personal freedom by denying individuals the liberty to do what they want with their own bodies.

But, society has decided that we should limit personal freedom and deny individuals the ability to harm themselves in some ways. That makes sense in many cases but now the question is should brokers limit choices?

Vanguard Reduces Choices

Vanguard Group, according to The Wall Street Journal, “will no longer allow individual investors to make new trades on certain investments that seek to magnify bets, pouring cold water on strategies that became popular after the last financial crisis.

Starting January 22, customers won’t be able to purchase so-called leveraged or inverse products via Vanguard’s brokerage platform, the firm said in a release this past week. That cuts out roughly 400 such securities and funds currently offered on that platform.

The move by the world’s second-largest money manager by assets comes as these complex products gain traction among investors and increased scrutiny from regulators because of the risks involved. Leveraged funds magnify gains–or losses–of an index while inverse products seek to produce the opposite performance of an index.

Annual volumes for one popular product, ProShares Ultra VIX Short-Term Futures Exchange-Traded Fund, have soared nearly 40-fold to about two billion shares traded in 2018 from roughly 50 million in 2016, FactSet data show.

Vanguard said in its release that it is taking action because the products are “generally incompatible with a buy-and-hold strategy.”

The firm hasn’t offered leveraged or inverse products of its own. Brokerage customers who bought such financial instruments before the deadline can continue to own them, sell the products or transfer them to a different institution.

A spokesman for ProShares said “for over 25 years, these funds have helped investors manage risk and enhance returns, including by hedging their portfolios during market downturns.”

Regulators have raised questions about these types of products. Last year Securities and Exchange Commissioner Kara Stein warned in a speech about the rise in leveraged strategies, questioning whether certain “complex and esoteric” products should target individual investors.

In a 2017 agreement with the Financial Industry Regulatory Authority, Wells Fargo & Co. compensated customers after recommending exchange-traded products linked to stock-market volatility without fully understanding the risks.

That followed a $2 million fine for Wells Fargo in 2012 for violations related to leveraged, inverse and inverse leveraged products. At the time of the second penalty, a Wells Fargo spokeswoman said the firm was committed to helping its clients achieve their investment goals.

Leveraged and inverse funds that wager on volatility gained prominence after the last financial crisis as a way to bet on the size and severity of stock-market moves.

Some, like the ProShares Short VIX Short-Term Futures ETF, were used to execute the so-called short-volatility trade that markets would stay calm.

Vanguard chart

Source: FactSet

When markets turned volatile last February, some funds that bet against volatility suffered losses, prompting the closure of an inverse exchange traded note. Some investors have sought to recoup losses by suing Credit Suisse Group AG , which managed the note that closed.

Credit Suisse, which declined to comment, has said in a court filing that investors were warned that holding the exchange-traded product as a long-term investment could cause losses.

UVXY does show an extreme long term down trend.

UVXY weekly chart

Other retail brokerages like Charles Schwab Corp. , TD Ameritrade Holding Corp. and Fidelity Investments still offer the products, though investors opting to buy them receive additional prompts to make them aware of risks.

A Vanguard spokeswoman, Emily Farrell, said the decision to ban the products from the company’s brokerage platform wasn’t connected to any recent market volatility. Last summer Vanguard decided to make online trading of all exchange-traded funds available on its brokerage platform commission free – with the exception of leveraged and inverse products.

Ms. Farrell added that these products represent a small segment of hundreds of thousands of securities that Vanguard’s customers can buy and sell. “A very small proportion of our client base utilizes these types of investments,” she said.

The funds that can no longer be traded include volatility product ProShares Ultra VIX Short-Term Futures ETF, known by its stock symbol UVXY, and the ProShares UltraPro QQQ, or TQQQ, which had about $3.5 billion in assets as of Friday, FactSet data show.”

Is Vanguard Right?

Should individual investors have access to these funds? Vanguard is correct that the inverse and leveraged ETFs are generally not appropriate for long term positions. They are, of course, not designed to be.

The prospectus of these products clearly explain that they are rebalanced on a daily basis. This means they track the trend for one day at a time. They usually do exactly what they intended to do and follow the trend for just one day, resetting to ensure they meet that objective the next day.

This means they can be a valuable tool for short term traders and the 2008 bear market demonstrates the potential appeal of these positions. Shown below is a chart of the ProShares Ultra Short Small Cap ETF (NYSE: SDD).

SDD weekly chart

This ETF delivered a gain of more than 220% as the stock market plunged. The gains were not delivered in a straight line and there was significant day to day volatility.

While the funds have value, they are short term and high risk. Options could also be appealing to short term traders and it could be best for traders to consider buying put options when they believe that the stock market is vulnerable to a sell off.

With options, traders can control their exposure. They should also understand the risks of any investment and brokers are likely to limit access to risky investments as they always have. This is part of their role in the financial system.


Economy

Bearish Sentiment Could Mean More Gains for Gold

One of the indicators many analysts consider in their market outlook is sentiment. This is usually applied as a contrary indicator.

This type of investing is defined by Investopedia as “Contrarian investing is an investment style in which investors purposefully go against prevailing market trends by selling when others are buying and buying when most investors are selling.

Contrarian investors believe that people who say the market is going up do so only when they are fully invested and have no further purchasing power. At this point, the market is at a peak. So, when people predict a downturn, they have already sold out, and the market can only go up at this point.”

Based on that type of analysis, gold could be a buy.

Skepticism About Gold

A recent article in The Wall Street Journal began with the headline, “Gold Prices Staged a Comeback, but Is It Sustainable?” As expected, based on that headline, the article warned investors that now might be the best time to look at adding gold to their portfolio.

The author noted, “Gold’s impressive rally since late last year already is facing a challenge: renewed confidence in the U.S. economy and a rebound in stocks.”

The S&P 500 sank 14% in the fourth quarter, driving investors into safer assets. Gold futures reaped the benefits, rallying 7.3%. Prices are currently near their highest level since June.

But analysts say that looking into 2019, investors remain largely confident that the U.S. economy will continue expanding. That means many likely will opt to ride out the volatility in share prices, rather than pile into havens such as gold.

The precious metal also has benefited from recent Federal Reserve comments that the central bank is willing to hit the brakes on its interest-rate increases in 2019 if growth slows.

When rates don’t rise as rapidly, gold becomes more attractive relative to yield-bearing securities such as Treasurys. A softer dollar also lifts the metal’s appeal by making it cheaper for overseas buyers.

losing luster chart

Source: The Wall Street Journal

“Yet those same Fed comments also have boosted stocks and other risky assets this year—a development that could potentially lure investors back into such markets.

In other words, the gold market risks a repeat of what happened during much of last year. Faith in U.S. growth dampened demand for bullion. Prices tumbled as much as 10% last year, hitting a roughly 18-month low in August. The S&P 500 climbed as much as 9.6%, hitting multiple records.

[Recently], gold fell for a second consecutive session, while the benchmark equity gauge rose for a fifth straight day.

With gold, “the buying we’re seeing come in is cautious,” said Bob Haberkorn, senior market strategist at RJO Futures. “People are buying it mostly because of what’s going on with the Federal Reserve. That’s a different type of buying.”

The demand picture is mixed. Flows into gold-backed exchange-traded funds rose late in 2018, topping $3 billion last month for the first time since April, according to the World Gold Council.

But hedge funds and other speculative investors have remained wary. Bullish bets on prices barely exceeded bearish wagers on gold during the week ended Dec. 18, according to the latest figures from the Commodity Futures Trading Commission.

That is a shift from the second half of last year, when bearish bets topped bullish ones, but steady U.S. economic data or a resolution to the U.S.-China trade fight could quickly improve the outlook for global growth, souring sentiment toward gold.

Demand for physical bullion among individual investors also has been lackluster. Last year, annual sales of American Eagles, a popular gold coin that is a proxy for retail sales, fell to their lowest level since 2007, U.S. Mint data show. The weakness continued late into the year.

Prices still haven’t cleared the closely watched $1,300 level, indicating the metal could be stuck in its current range.

“If the Fed does in fact turn neutral to dovish, the rally in gold will be in contained because equities will also turn higher,” Mr. Haberkorn said.”

The Trend Is Your Friend

While the article does show that annual sales of gold coins are off and that there reasons to be skeptical of gold, many traders like to say that a bull market climbs a wall of worry. Those worrying about gold could be missing an opportunity.

Consider the next chart which shows the price of gold in the futures market.

Gold daily chart

The trend in this chart is clearly up. It is what technical analysts would call an orderly up trend rather than a sharply rising up trend that is commonly associated with bubbles. An orderly trend is one that is usually considered to be sustainable.

The longer term trend, based on weekly data is shown in the next chart.

Gold weekly chart

This is also a bullish picture. The price could be in a broad consolidation pattern for the past two years and could be expected to rally back to the recent highs. A break out of the range could indicate a rally of more than 12% is likely.

And, there is the importance of noting gold’s role as a safe haven investment. As The Wall street Journal noted just weeks ago, when the author was more bullish on gold,

“Uneven economic data and volatility in stocks have accelerated a surge into assets perceived as relatively safe, highlighting the unease felt by many investors at the start of 2019.

The Japanese yen is up nearly 5% against the dollar since markets began sliding at the end of last year’s third quarter. That move picked up speed after weaker-than-expected manufacturing data and a sales warning from Apple Inc. last week bolstered fears of a global slowdown.

Other so-called haven assets are also rising. Gold prices have strengthened around 7% in that period and stand near their highest level in about half a year, and gold-focused funds have notched inflows in 12 of the past 13 weeks, according to fund tracker EPFR Global.”

Now could be a time to ignore the skeptics and consider adding gold to a portfolio.